RBS 2008 Annual Report Download - page 109
Download and view the complete annual report
Please find page 109 of the 2008 RBS annual report below. You can navigate through the pages in the report by either clicking on the pages listed below, or by using the keyword search tool below to find specific information within the annual report.-
 1
1 -
2
-
3
-
4
-
5
-
6
-
7
-
8
-
9
-
10
-
11
-
12
-
13
-
14
-
15
-
16
-
17
-
18
-
19
-
20
-
21
-
22
-
23
-
24
-
25
-
26
-
27
-
28
-
29
-
30
-
31
-
32
-
33
-
34
-
35
-
36
-
37
-
38
-
39
-
40
-
41
-
42
-
43
-
44
-
45
-
46
-
47
-
48
-
49
-
50
-
51
-
52
-
53
-
54
-
55
-
56
-
57
-
58
-
59
-
60
-
61
-
62
-
63
-
64
-
65
-
66
-
67
-
68
-
69
-
70
-
71
-
72
-
73
-
74
-
75
-
76
-
77
-
78
-
79
-
80
-
81
-
82
-
83
-
84
-
85
-
86
-
87
-
88
-
89
-
90
-
91
-
92
-
93
-
94
-
95
-
96
-
97
-
98
-
 99
99 -
 100
100 -
 101
101 -
 102
102 -
 103
103 -
 104
104 -
 105
105 -
 106
106 -
 107
107 -
 108
108 -
 109
109 -
 110
110 -
 111
111 -
 112
112 -
 113
113 -
 114
114 -
 115
115 -
 116
116 -
 117
117 -
 118
118 -
 119
119 -
120
-
121
-
122
-
123
-
124
-
125
-
126
-
127
-
128
-
129
-
130
-
131
-
132
-
133
-
134
-
135
-
136
-
137
-
138
-
139
-
140
-
141
-
142
-
143
-
144
-
145
-
146
-
147
-
148
-
149
-
150
-
151
-
152
-
153
-
154
-
155
-
156
-
157
-
158
-
159
-
160
-
161
-
162
-
163
-
164
-
165
-
166
-
167
-
168
-
169
-
170
-
171
-
172
-
173
-
174
-
175
-
176
-
177
-
178
-
179
-
180
-
181
-
182
-
183
-
184
-
185
-
186
-
187
-
188
-
189
-
190
-
191
-
192
-
193
-
194
-
195
-
196
-
197
-
198
-
199
-
200
-
201
-
202
-
203
-
204
-
205
-
206
-
207
-
208
-
209
-
210
-
211
-
212
-
213
-
214
-
215
-
216
-
217
-
218
-
219
-
220
-
221
-
222
-
223
-
224
-
225
-
226
-
227
-
228
-
229
-
230
-
231
-
232
-
233
-
234
-
235
-
236
-
237
-
238
-
239
-
240
-
241
-
242
-
243
-
244
-
245
-
246
-
247
-
248
-
249
-
250
-
251
-
252
-
253
-
254
-
255
-
256
-
257
-
258
-
259
-
260
-
261
-
262
-
263
-
264
-
265
-
266
-
267
-
268
-
269
-
270
-
271
-
272
-
273
-
274
-
275
-
276
-
277
-
278
-
279
-
280
-
281
-
282
-
283
-
284
-
285
-
286
-
287
-
288
-
289
-
290
-
291
-
292
-
293
-
294
-
295
-
296
-
297
-
298
-
299
 |
 |

RBS Group Annual Report and Accounts 2008108
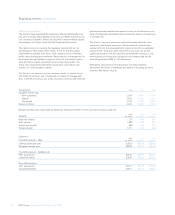
Business review continued
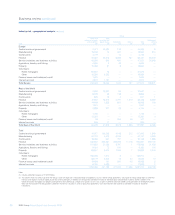
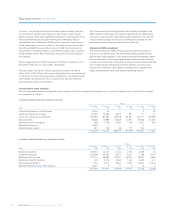
Market risk (audited)
Market risk arises from changes in interest rates, foreign currency, credit
spread, equity prices and risk related factors such as market volatilities.
Market risk is actively managed and aligned with the Group’s risk
appetite. Market conditions were difficult throughout 2008 with
significant volatility and write-downs across markets and portfolios.
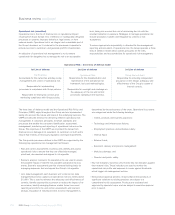
The Group manages market risk in the trading and non-trading
(treasury) portfolios using the market risk management framework. The
framework includes value-at-risk (VaR) limits, backtesting, stress testing,
scenario analysis, position/sensitivity analysis and model validation.
The focus through 2008 has been on overhauling and reviewing the
market risk limits for trading book activities, reflecting market
performance and events.
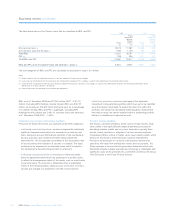
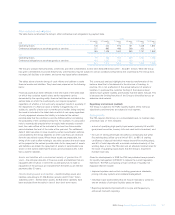
Measurement (audited)
A number of techniques are used to calculate the Group’s exposure to
market risk, including VaR, sensitivity analysis and stress testing.
VaR is a technique that produces estimates of the potential change in
the market value of a portfolio over a specified time horizon at given
confidence levels. For internal risk management purposes, the Group’s
VaR assumes a time horizon of one trading day and a confidence level
of 95%. The trading book market risk is calculated using VaR at a
confidence level of 99% and a time horizon of ten trading days. From
2009, the Group is adopting 99% confidence limits, in line with industry
practice.
The Group calculates VaR using historical simulation models but does
not make any assumption about the nature or type of underlying loss
distribution. The methodology uses the previous 500 trading days of
market data and calculates both general market risk (i.e. the risk due to
movement in general market benchmarks) and idiosyncratic market risk
(i.e. the risk due to movements in the value of securities by reference to
specific issuers). All VaR models have limitations, which include:
•Historical data may not provide the best estimate of the joint
distribution of risk factor changes in the future and may fail to capture
the risk of possible extreme adverse market movements which have
not occurred in the historical window used in the calculations.
•VaR using a one-day time horizon does not fully capture the market
risk of positions that cannot be liquidated or hedged within one day.
•VaR using a 95% confidence level does not reflect the extent of
potential losses beyond that percentile.
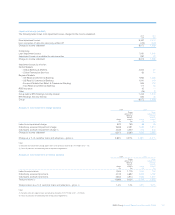
Traded portfolios (audited)
The primary focus of the Group’s trading activities is client facilitation.
The Group also undertakes:
•Market making – quoting firm bid (buy) and offer (sell) prices with the
intention of profiting from the spread between the quotes.
•Arbitrage – entering into offsetting positions in different but closely
related markets in order to profit from market imperfections.
•Proprietary activity – taking positions in financial instruments as
principal in order to take advantage of anticipated market conditions.
Financial instruments held in the Group’s trading portfolios include, but
are not limited to: debt securities, loans, deposits, equities, securities
sale and repurchase agreements and derivative financial instruments
(futures, forwards, swaps and options).
The Group participates in exchange traded and over the counter (OTC)
derivatives markets. The Group buys and sells financial instruments that
are traded or cleared on an exchange, including interest rate swaps,
futures and options. Holders of exchange traded instruments provide
margin daily with cash or other security at the exchange, to which the
holders look for ultimate settlement. The Group also buys and sells
financial instruments that are traded OTC, rather than on a recognised
exchange. These instruments range from commoditised transactions in
derivative markets, to trades where the specific terms are tailored to the
requirements of the Group’s customers. In many cases, industry
standard documentation is used, most commonly in the form of a
master agreement, with individual transaction confirmations.
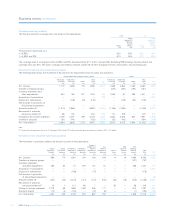
The Group calculates the VaR of trading portfolios at the close of
business and positions may change substantially during the course of a
trading day. Further controls are in place to limit the Group’s intra-day
exposure, such as the calculation of the VaR for selected portfolios. The
Group cannot guarantee that losses will not exceed the VaR amounts
indicated due to the limitations and nature of VaR measurements.