RBS 2008 Annual Report Download - page 205
Download and view the complete annual report
Please find page 205 of the 2008 RBS annual report below. You can navigate through the pages in the report by either clicking on the pages listed below, or by using the keyword search tool below to find specific information within the annual report.-
 1
1 -
2
-
3
-
4
-
5
-
6
-
7
-
8
-
9
-
10
-
11
-
12
-
13
-
14
-
15
-
16
-
17
-
18
-
19
-
20
-
21
-
22
-
23
-
24
-
25
-
26
-
27
-
28
-
29
-
30
-
31
-
32
-
33
-
34
-
35
-
36
-
37
-
38
-
39
-
40
-
41
-
42
-
43
-
44
-
45
-
46
-
47
-
48
-
49
-
50
-
51
-
52
-
53
-
54
-
55
-
56
-
57
-
58
-
59
-
60
-
61
-
62
-
63
-
64
-
65
-
66
-
67
-
68
-
69
-
70
-
71
-
72
-
73
-
74
-
75
-
76
-
77
-
78
-
79
-
80
-
81
-
82
-
83
-
84
-
85
-
86
-
87
-
88
-
89
-
90
-
91
-
92
-
93
-
94
-
95
-
96
-
97
-
98
-
99
-
100
-
101
-
102
-
103
-
104
-
105
-
106
-
107
-
108
-
109
-
110
-
111
-
112
-
113
-
114
-
115
-
116
-
117
-
118
-
119
-
120
-
121
-
122
-
123
-
124
-
125
-
126
-
127
-
128
-
129
-
130
-
131
-
132
-
133
-
134
-
135
-
136
-
137
-
138
-
139
-
140
-
141
-
142
-
143
-
144
-
145
-
146
-
147
-
148
-
149
-
150
-
151
-
152
-
153
-
154
-
155
-
156
-
157
-
158
-
159
-
160
-
161
-
162
-
163
-
164
-
165
-
166
-
167
-
168
-
169
-
170
-
171
-
172
-
173
-
174
-
175
-
176
-
177
-
178
-
179
-
180
-
181
-
182
-
183
-
184
-
185
-
186
-
187
-
188
-
189
-
190
-
191
-
192
-
193
-
194
-
 195
195 -
 196
196 -
 197
197 -
 198
198 -
 199
199 -
 200
200 -
 201
201 -
 202
202 -
 203
203 -
 204
204 -
 205
205 -
 206
206 -
 207
207 -
 208
208 -
 209
209 -
 210
210 -
 211
211 -
 212
212 -
 213
213 -
 214
214 -
 215
215 -
216
-
217
-
218
-
219
-
220
-
221
-
222
-
223
-
224
-
225
-
226
-
227
-
228
-
229
-
230
-
231
-
232
-
233
-
234
-
235
-
236
-
237
-
238
-
239
-
240
-
241
-
242
-
243
-
244
-
245
-
246
-
247
-
248
-
249
-
250
-
251
-
252
-
253
-
254
-
255
-
256
-
257
-
258
-
259
-
260
-
261
-
262
-
263
-
264
-
265
-
266
-
267
-
268
-
269
-
270
-
271
-
272
-
273
-
274
-
275
-
276
-
277
-
278
-
279
-
280
-
281
-
282
-
283
-
284
-
285
-
286
-
287
-
288
-
289
-
290
-
291
-
292
-
293
-
294
-
295
-
296
-
297
-
298
-
299
 |
 |

Notes on the accounts continued
RBS Group Annual Report and Accounts 2008204
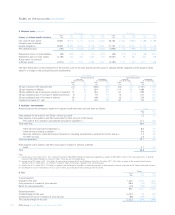
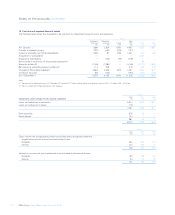
11 Financial instruments (continued)
tenor and nature of the trades that have been observed. This method is
most frequently used for US and UK RMBS. The RMBS of Dutch and
Spanish originated mortgages guaranteed by those governments are
valued using the credit spreads of the respective government debt and
certain assumptions made by the Group, or based on observable prices
from Bloomberg or consensus pricing services.
Where there is an absence of trading activity, models are used.
The Group primarily uses an industry standard model to project the
expected future cash flows to be received from the underlying
mortgages and to forecast how these cash flows will be distributed to
the various holders of the RMBS. This model utilises data provided by
the servicer of the underlying mortgage portfolio, layering on
assumptions for mortgage prepayments, probability of default,
expected losses, and yield. The Group uses data from third-party
sources to calibrate its assumptions, including pricing information from
third party pricing services, independent research, broker quotes, and
other independent sources. An assessment is made of third-party data
source to determine its applicability and reliability. The Group adjusts
the model price with a liquidity premium to reflect the price that the
instrument could be traded at in the market and may also make
adjustments for model deficiencies.
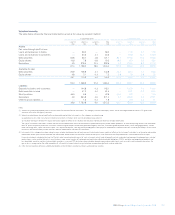
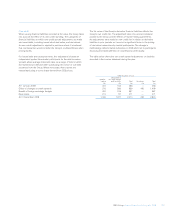
The weighted average of the key significant inputs utilised in valuing US
level 3 RMBS positions are shown in the table below.
The fair value of securities within each class of asset changes on a
broadly consistent basis in response to changes in given market factors.
However, the extent of the change, and therefore the range of
reasonably possible alternative assumptions, may be either more or less
pronounced, depending on the particular terms and circumstances of
the individual security. Through most of 2008, while default rates on
sub-prime mortgages were on the rise, there was less transparency and
historical data to predict future defaults on both Alt-A and prime
securities. As such, the Group felt that probability of default was the
least transparent input into Alt-A and prime RMBS modelled valuations
throughout 2008 (and most sensitive to variations). The Group believes
that a range of 500 basis points greater than and 500 basis points less
than the weighted average constant default rate, and a range of 200
basis points greater than and 200 basis points less than the weighted
average constant default rate represents a reasonably possible set of
acceptable pricing alternatives for Alt-A and prime RMBS, respectively.
These assumptions consider the inherently risky nature of Alt-A over
prime securities, as well as declining economic conditions leading to an
increased likelihood of default at year-end. While other key inputs may
possess characteristics of unobservability in both Alt-A and prime
modelled valuations, the effect of utilising reasonably possible
alternatives for these respective inputs would have an immaterial effect
on the overall valuation. Using these reasonably possible alternative
assumptions the fair value of RMBS of £0.5 billion would be £90 million
lower or £40 million higher.
Commercial mortgage backed securities
CMBS is valued using an industry standard model and the inputs, where
possible, are corroborated using observable market data.
For senior CMBS and subordinated tranches, the Group determined
that the most sensitive input to reasonably possible alternatives valuation
is probability of default and yield respectively. Using reasonably possible
alternative assumptions for these inputs, the fair value of CMBS of
£0.6 billion would be £30 million lower or £30 million higher.
Collateralised debt obligations
CDOs purchased from third parties are valued using independent, third-
party quotes or independent lead manager indicative prices. For super
senior CDOs which have been originated by the Group no specific third-
party information is available. The valuation of these super senior CDOs
therefore takes into consideration outputs from a proprietary model,
market data and appropriate valuation adjustments.
The Group’s proprietary model calculates the expected cashflows from
the underlying mortgages using assumptions, derived from publicly
available data on future macroeconomic conditions (including house
price appreciation and depreciation) and on defaults and delinquencies
on these underlying mortgages. The model used by the Group comprises
an econometric loan-level model which provides the input to an industry
standard ABS model, the output of which feeds a proprietary model
generating expected cashflows which are discounted using a risk
adjusted rate.
Weighted–average inputs
Non-agency
2008 prime RMBS Alt-A RMBS
Yield 11.02% 20.69%
Probability of default 3.00 CDR(1) 40.00 CDR(1)
Loss severity 45.00%(2) 52.25%(2)
Prepayment 12.67 CPR 10.65 CPR
Notes:
(1) Constant default rate or probability of default.
(2) Constant prepayment rate.