RBS 2008 Annual Report Download - page 208
Download and view the complete annual report
Please find page 208 of the 2008 RBS annual report below. You can navigate through the pages in the report by either clicking on the pages listed below, or by using the keyword search tool below to find specific information within the annual report.-
 1
1 -
2
-
3
-
4
-
5
-
6
-
7
-
8
-
9
-
10
-
11
-
12
-
13
-
14
-
15
-
16
-
17
-
18
-
19
-
20
-
21
-
22
-
23
-
24
-
25
-
26
-
27
-
28
-
29
-
30
-
31
-
32
-
33
-
34
-
35
-
36
-
37
-
38
-
39
-
40
-
41
-
42
-
43
-
44
-
45
-
46
-
47
-
48
-
49
-
50
-
51
-
52
-
53
-
54
-
55
-
56
-
57
-
58
-
59
-
60
-
61
-
62
-
63
-
64
-
65
-
66
-
67
-
68
-
69
-
70
-
71
-
72
-
73
-
74
-
75
-
76
-
77
-
78
-
79
-
80
-
81
-
82
-
83
-
84
-
85
-
86
-
87
-
88
-
89
-
90
-
91
-
92
-
93
-
94
-
95
-
96
-
97
-
98
-
99
-
100
-
101
-
102
-
103
-
104
-
105
-
106
-
107
-
108
-
109
-
110
-
111
-
112
-
113
-
114
-
115
-
116
-
117
-
118
-
119
-
120
-
121
-
122
-
123
-
124
-
125
-
126
-
127
-
128
-
129
-
130
-
131
-
132
-
133
-
134
-
135
-
136
-
137
-
138
-
139
-
140
-
141
-
142
-
143
-
144
-
145
-
146
-
147
-
148
-
149
-
150
-
151
-
152
-
153
-
154
-
155
-
156
-
157
-
158
-
159
-
160
-
161
-
162
-
163
-
164
-
165
-
166
-
167
-
168
-
169
-
170
-
171
-
172
-
173
-
174
-
175
-
176
-
177
-
178
-
179
-
180
-
181
-
182
-
183
-
184
-
185
-
186
-
187
-
188
-
189
-
190
-
191
-
192
-
193
-
194
-
195
-
196
-
197
-
 198
198 -
 199
199 -
 200
200 -
 201
201 -
 202
202 -
 203
203 -
 204
204 -
 205
205 -
 206
206 -
 207
207 -
 208
208 -
 209
209 -
 210
210 -
 211
211 -
 212
212 -
 213
213 -
 214
214 -
 215
215 -
 216
216 -
 217
217 -
 218
218 -
219
-
220
-
221
-
222
-
223
-
224
-
225
-
226
-
227
-
228
-
229
-
230
-
231
-
232
-
233
-
234
-
235
-
236
-
237
-
238
-
239
-
240
-
241
-
242
-
243
-
244
-
245
-
246
-
247
-
248
-
249
-
250
-
251
-
252
-
253
-
254
-
255
-
256
-
257
-
258
-
259
-
260
-
261
-
262
-
263
-
264
-
265
-
266
-
267
-
268
-
269
-
270
-
271
-
272
-
273
-
274
-
275
-
276
-
277
-
278
-
279
-
280
-
281
-
282
-
283
-
284
-
285
-
286
-
287
-
288
-
289
-
290
-
291
-
292
-
293
-
294
-
295
-
296
-
297
-
298
-
299
 |
 |

207RBS Group Annual Report and Accounts 2008
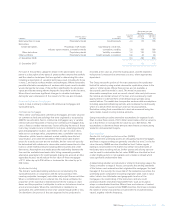
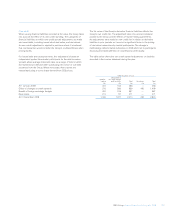
Own credit
When valuing financial liabilities recorded at fair value, the Group takes
into account the effect of its own credit standing. The categories of
financial liabilities on which own credit spread adjustments are made
are issued debt, including issued structured notes, and derivatives.
An own credit adjustment is applied to positions where it is believed
that counterparties would consider the Group’s creditworthiness when
pricing trades.
For issued debt and structured notes, this adjustment is based on
independent quotes from market participants for the debt issuance
spreads above average inter-bank rates (at a range of tenors) which
the market would demand when purchasing new senior or sub-debt
issuances from the Group. Where necessary, these quotes are
interpolated using a curve shape derived from CDS prices.
The fair value of the Group’s derivative financial liabilities reflects the
Group’s own credit risk. The adjustment takes into account collateral
posted by the Group and the effects of master netting agreements.
No adjustments were made for own credit risk in relation to derivative
liabilities in prior periods as it was not a significant factor in the pricing
of derivative transactions by market participants. The change in
methodology reflects market turbulence in 2008 which led to participants
focussing increased attention on counterparty credit quality.
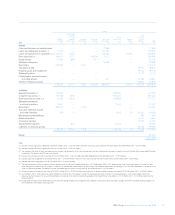
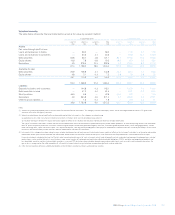
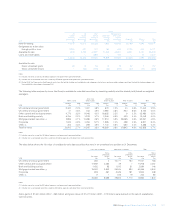
The table below shows the own credit spread adjustments on liabilities
recorded in the income statement during the year.
Debt securities in issue
Designated at
Held-for- fair value through
trading profit and loss Total Derivatives Total
£m £m £m £m £m
At 1 January 2008 304 152 456 — 456
Effect of changes to credit spreads 376 583 959 450 1,409
Benefit of foreign exchange hedges 392 195 587 — 587
New issues 274 97 371 — 371
At 31 December 2008 1,346 1,027 2,373 450 2,823