RBS 2008 Annual Report Download - page 251
Download and view the complete annual report
Please find page 251 of the 2008 RBS annual report below. You can navigate through the pages in the report by either clicking on the pages listed below, or by using the keyword search tool below to find specific information within the annual report.-
 1
1 -
2
-
3
-
4
-
5
-
6
-
7
-
8
-
9
-
10
-
11
-
12
-
13
-
14
-
15
-
16
-
17
-
18
-
19
-
20
-
21
-
22
-
23
-
24
-
25
-
26
-
27
-
28
-
29
-
30
-
31
-
32
-
33
-
34
-
35
-
36
-
37
-
38
-
39
-
40
-
41
-
42
-
43
-
44
-
45
-
46
-
47
-
48
-
49
-
50
-
51
-
52
-
53
-
54
-
55
-
56
-
57
-
58
-
59
-
60
-
61
-
62
-
63
-
64
-
65
-
66
-
67
-
68
-
69
-
70
-
71
-
72
-
73
-
74
-
75
-
76
-
77
-
78
-
79
-
80
-
81
-
82
-
83
-
84
-
85
-
86
-
87
-
88
-
89
-
90
-
91
-
92
-
93
-
94
-
95
-
96
-
97
-
98
-
99
-
100
-
101
-
102
-
103
-
104
-
105
-
106
-
107
-
108
-
109
-
110
-
111
-
112
-
113
-
114
-
115
-
116
-
117
-
118
-
119
-
120
-
121
-
122
-
123
-
124
-
125
-
126
-
127
-
128
-
129
-
130
-
131
-
132
-
133
-
134
-
135
-
136
-
137
-
138
-
139
-
140
-
141
-
142
-
143
-
144
-
145
-
146
-
147
-
148
-
149
-
150
-
151
-
152
-
153
-
154
-
155
-
156
-
157
-
158
-
159
-
160
-
161
-
162
-
163
-
164
-
165
-
166
-
167
-
168
-
169
-
170
-
171
-
172
-
173
-
174
-
175
-
176
-
177
-
178
-
179
-
180
-
181
-
182
-
183
-
184
-
185
-
186
-
187
-
188
-
189
-
190
-
191
-
192
-
193
-
194
-
195
-
196
-
197
-
198
-
199
-
200
-
201
-
202
-
203
-
204
-
205
-
206
-
207
-
208
-
209
-
210
-
211
-
212
-
213
-
214
-
215
-
216
-
217
-
218
-
219
-
220
-
221
-
222
-
223
-
224
-
225
-
226
-
227
-
228
-
229
-
230
-
231
-
232
-
233
-
234
-
235
-
236
-
237
-
238
-
239
-
240
-
 241
241 -
 242
242 -
 243
243 -
 244
244 -
 245
245 -
 246
246 -
 247
247 -
 248
248 -
 249
249 -
 250
250 -
 251
251 -
 252
252 -
 253
253 -
 254
254 -
 255
255 -
 256
256 -
 257
257 -
 258
258 -
 259
259 -
 260
260 -
 261
261 -
262
-
263
-
264
-
265
-
266
-
267
-
268
-
269
-
270
-
271
-
272
-
273
-
274
-
275
-
276
-
277
-
278
-
279
-
280
-
281
-
282
-
283
-
284
-
285
-
286
-
287
-
288
-
289
-
290
-
291
-
292
-
293
-
294
-
295
-
296
-
297
-
298
-
299
 |
 |

RBS Group Annual Report and Accounts 2008250
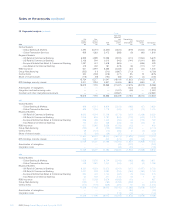
Notes on the accounts continued
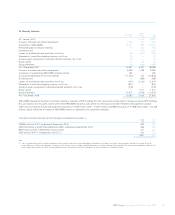
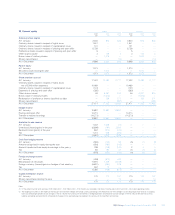
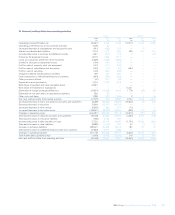
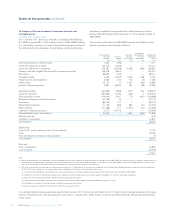
31 Capital resources
The Group’s regulatory capital resources at 31 December in accordance with Financial Services Authority (FSA) definitions were as follows:
Basel II Basel I
2008 2007
Composition of regulatory capital £m £m
Tier 1:
Ordinary shareholders' equity 45,525 44,684
Minority interests 21,619 38,388
Adjustment for:
– Goodwill and other intangible assets (20,049) (48,492)
– Goodwill and other intangible assets of discontinued businesses — (3,232)
– Unrealised losses on available-for-sale debt securities 3,687 630
– Reserves arising on revaluation of property and unrealised gains on available-for-sale equities (984) (3,321)
– Reallocation of preference shares and innovative securities (1,813) (1,813)
– Other regulatory adjustments (362) 480
Core Tier 1 capital 47,623 27,324
Preference shares 16,655 10,560
Innovative Tier 1 securities 7,383 6,480
Tax on the excess of expected losses over provisions 615 n/a
Tier 1 deductions (2,429) n/a
Total Tier 1 capital 69,847 44,364
Tier 2:
Reserves arising on revaluation of property and unrealised gains on available-for-sale equities 984 3,321
Collective impairment allowances 666 2,582
Perpetual subordinated debt 9,829 9,042
Term subordinated debt 23,162 18,639
Minority and other interests in Tier 2 capital 11 109
Tier 2 deductions (2,429) n/a
Total Tier 2 capital 32,223 33,693
Tier 3 260 200
Supervisory deductions:
Unconsolidated investments 4,044 4,297
Other deductions 111 5,986
Total deductions other than from Tier 1 capital 4,155 10,283
Total regulatory capital 98,175 67,974
It is the Group’s policy to maintain a strong capital base, to expand it as
appropriate and to utilise it efficiently throughout its activities to optimise
the return to shareholders while maintaining a prudent relationship
between the capital base and the underlying risks of the business. In
carrying out this policy, the Group has regard to the supervisory
requirements of the FSA. The FSA uses Risk Asset Ratio (RAR) as a
measure of capital adequacy for UK banks, comparing a bank’s capital
resources with its risk-weighted assets (the assets and off-balance
sheet exposures are ‘weighted’ to reflect the inherent credit and other
risks); by international agreement, the RAR should be not less than 8%
with a Tier 1 component of not less than 4%. The Group has complied
with the FSAs capital requirements throughout the year.
A number of subsidiaries and sub-groups within the Group, principally
banking and insurance entities, are subject to various individual
regulatory capital requirements in the UK and overseas.