RBS 2008 Annual Report Download - page 49
Download and view the complete annual report
Please find page 49 of the 2008 RBS annual report below. You can navigate through the pages in the report by either clicking on the pages listed below, or by using the keyword search tool below to find specific information within the annual report.-
 1
1 -
2
-
3
-
4
-
5
-
6
-
7
-
8
-
9
-
10
-
11
-
12
-
13
-
14
-
15
-
16
-
17
-
18
-
19
-
20
-
21
-
22
-
23
-
24
-
25
-
26
-
27
-
28
-
29
-
30
-
31
-
32
-
33
-
34
-
35
-
36
-
37
-
38
-
 39
39 -
 40
40 -
 41
41 -
 42
42 -
 43
43 -
 44
44 -
 45
45 -
 46
46 -
 47
47 -
 48
48 -
 49
49 -
 50
50 -
 51
51 -
 52
52 -
 53
53 -
 54
54 -
 55
55 -
 56
56 -
 57
57 -
 58
58 -
 59
59 -
60
-
61
-
62
-
63
-
64
-
65
-
66
-
67
-
68
-
69
-
70
-
71
-
72
-
73
-
74
-
75
-
76
-
77
-
78
-
79
-
80
-
81
-
82
-
83
-
84
-
85
-
86
-
87
-
88
-
89
-
90
-
91
-
92
-
93
-
94
-
95
-
96
-
97
-
98
-
99
-
100
-
101
-
102
-
103
-
104
-
105
-
106
-
107
-
108
-
109
-
110
-
111
-
112
-
113
-
114
-
115
-
116
-
117
-
118
-
119
-
120
-
121
-
122
-
123
-
124
-
125
-
126
-
127
-
128
-
129
-
130
-
131
-
132
-
133
-
134
-
135
-
136
-
137
-
138
-
139
-
140
-
141
-
142
-
143
-
144
-
145
-
146
-
147
-
148
-
149
-
150
-
151
-
152
-
153
-
154
-
155
-
156
-
157
-
158
-
159
-
160
-
161
-
162
-
163
-
164
-
165
-
166
-
167
-
168
-
169
-
170
-
171
-
172
-
173
-
174
-
175
-
176
-
177
-
178
-
179
-
180
-
181
-
182
-
183
-
184
-
185
-
186
-
187
-
188
-
189
-
190
-
191
-
192
-
193
-
194
-
195
-
196
-
197
-
198
-
199
-
200
-
201
-
202
-
203
-
204
-
205
-
206
-
207
-
208
-
209
-
210
-
211
-
212
-
213
-
214
-
215
-
216
-
217
-
218
-
219
-
220
-
221
-
222
-
223
-
224
-
225
-
226
-
227
-
228
-
229
-
230
-
231
-
232
-
233
-
234
-
235
-
236
-
237
-
238
-
239
-
240
-
241
-
242
-
243
-
244
-
245
-
246
-
247
-
248
-
249
-
250
-
251
-
252
-
253
-
254
-
255
-
256
-
257
-
258
-
259
-
260
-
261
-
262
-
263
-
264
-
265
-
266
-
267
-
268
-
269
-
270
-
271
-
272
-
273
-
274
-
275
-
276
-
277
-
278
-
279
-
280
-
281
-
282
-
283
-
284
-
285
-
286
-
287
-
288
-
289
-
290
-
291
-
292
-
293
-
294
-
295
-
296
-
297
-
298
-
299
 |
 |

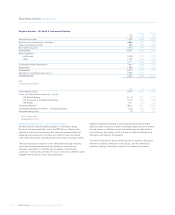
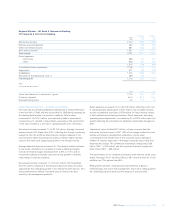
RBS Group Annual Report and Accounts 200848
Business review continued
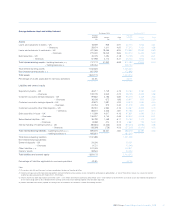
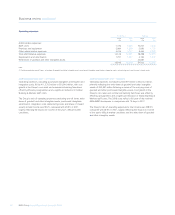
2008 compared with 2007 – pro forma
Credit impairment losses (excluding reclassified assets) increased to
£6,962 million in 2008, compared with £2,104 million in 2007. The Group
experienced a pronounced deterioration in impairments during the year,
as financial stress spread to a broad range of customers. The greatest
increase in impairments occurred in Global Banking & Markets.
However, the Regional Markets businesses in all geographies also
experienced a noticeable increase in impairments during the year,
particularly in the UK SME and US personal segments.
Total balance sheet provisions for impairment amounted to £9,451
million compared with £4,956 million in 2007.
Total provision coverage (the ratio of total balance sheet provisions for
impairment to total risk elements in lending) decreased from 60% to
50%. The ratio of total balance sheet provisions for impairment to total
risk elements in lending and potential problem loans also decreased to
50% compared with 59% in 2007.
2008 compared with 2007 – statutory
Credit impairment losses increased to £8,072 million in 2008, compared
with £1,968 million in 2007. The Group experienced a pronounced
deterioration in impairments during the year, as financial stress spread
to a broad range of customers. The greatest increase in impairments
occurred in Global Banking & Markets. However, the Regional Markets
businesses in all geographies also experienced a noticeable increase in
impairments during the year, particularly in the UK SME and US
personal segments.
Total balance sheet provisions for impairment amounted to £11,016
million compared with £6,452 million in 2007.
Total provision coverage (the ratio of total balance sheet provisions for
impairment to total risk elements in lending) decreased from 60% to
52%. The ratio of total balance sheet provisions for impairment to total
risk elements in lending and potential problem loans also decreased to
51% compared with 57% in 2007.
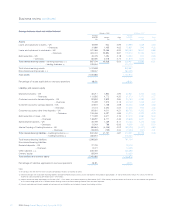
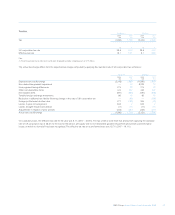
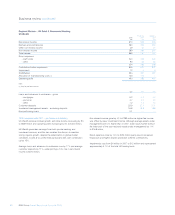
Impairment
Pro forma (1) Statutory
2008 2007 2008 2007
£m £m £m £m
New impairment 7,223 2,379 8,391 2,310
less: recoveries of amounts previously written-off (261) (275) (319) (342)
Charge to income statement 6,962 2,104 8,072 1,968
Comprising:
Loan impairment 6,478 2,082 7,091 1,946
Impairment of available-for-sale securities 484 22 981 22
Charge to income statement 6,962 2,104 8,072 1,968
Note:
(1) Pro forma excludes impairment losses on reclassified assets.