RBS 2008 Annual Report Download - page 136
Download and view the complete annual report
Please find page 136 of the 2008 RBS annual report below. You can navigate through the pages in the report by either clicking on the pages listed below, or by using the keyword search tool below to find specific information within the annual report.-
 1
1 -
2
-
3
-
4
-
5
-
6
-
7
-
8
-
9
-
10
-
11
-
12
-
13
-
14
-
15
-
16
-
17
-
18
-
19
-
20
-
21
-
22
-
23
-
24
-
25
-
26
-
27
-
28
-
29
-
30
-
31
-
32
-
33
-
34
-
35
-
36
-
37
-
38
-
39
-
40
-
41
-
42
-
43
-
44
-
45
-
46
-
47
-
48
-
49
-
50
-
51
-
52
-
53
-
54
-
55
-
56
-
57
-
58
-
59
-
60
-
61
-
62
-
63
-
64
-
65
-
66
-
67
-
68
-
69
-
70
-
71
-
72
-
73
-
74
-
75
-
76
-
77
-
78
-
79
-
80
-
81
-
82
-
83
-
84
-
85
-
86
-
87
-
88
-
89
-
90
-
91
-
92
-
93
-
94
-
95
-
96
-
97
-
98
-
99
-
100
-
101
-
102
-
103
-
104
-
105
-
106
-
107
-
108
-
109
-
110
-
111
-
112
-
113
-
114
-
115
-
116
-
117
-
118
-
119
-
120
-
121
-
122
-
123
-
124
-
125
-
 126
126 -
 127
127 -
 128
128 -
 129
129 -
 130
130 -
 131
131 -
 132
132 -
 133
133 -
 134
134 -
 135
135 -
 136
136 -
 137
137 -
 138
138 -
 139
139 -
 140
140 -
 141
141 -
 142
142 -
 143
143 -
 144
144 -
 145
145 -
 146
146 -
147
-
148
-
149
-
150
-
151
-
152
-
153
-
154
-
155
-
156
-
157
-
158
-
159
-
160
-
161
-
162
-
163
-
164
-
165
-
166
-
167
-
168
-
169
-
170
-
171
-
172
-
173
-
174
-
175
-
176
-
177
-
178
-
179
-
180
-
181
-
182
-
183
-
184
-
185
-
186
-
187
-
188
-
189
-
190
-
191
-
192
-
193
-
194
-
195
-
196
-
197
-
198
-
199
-
200
-
201
-
202
-
203
-
204
-
205
-
206
-
207
-
208
-
209
-
210
-
211
-
212
-
213
-
214
-
215
-
216
-
217
-
218
-
219
-
220
-
221
-
222
-
223
-
224
-
225
-
226
-
227
-
228
-
229
-
230
-
231
-
232
-
233
-
234
-
235
-
236
-
237
-
238
-
239
-
240
-
241
-
242
-
243
-
244
-
245
-
246
-
247
-
248
-
249
-
250
-
251
-
252
-
253
-
254
-
255
-
256
-
257
-
258
-
259
-
260
-
261
-
262
-
263
-
264
-
265
-
266
-
267
-
268
-
269
-
270
-
271
-
272
-
273
-
274
-
275
-
276
-
277
-
278
-
279
-
280
-
281
-
282
-
283
-
284
-
285
-
286
-
287
-
288
-
289
-
290
-
291
-
292
-
293
-
294
-
295
-
296
-
297
-
298
-
299
 |
 |

135
RBS Group Annual Report and Accounts 2008
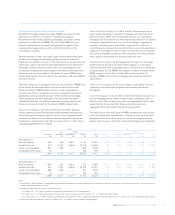
The widening of credit spreads of corporate and financial institution
counterparties during the year contributed to a significant increase in
the level of CVA adjustments recorded across all counterparties
particularly monoline insurers and credit derivative product companies.
The monoline insurer CVA is calculated on a trade-by-trade basis,
and is derived using market observable monoline credit spreads. The
majority of the monoline CVA is taken against credit derivatives hedging
exposures to ABS. The CDPC CVA is calculated using a similar
approach. However, in the absence of market observable credit
spreads, the cost of hedging the counterparty risk is estimated by
analysing the underlying trades and the cost of hedging expected
default losses in excess of the capital available in each vehicle.
The CVA for all other counterparties, including those in respect of
derivatives with banks, is calculated either on a trade-by-trade basis,
reflecting the estimated cost of hedging the risk through credit
derivatives, or on a portfolio basis reflecting an estimate of the amount
a third party would charge to assume the risk.
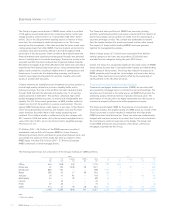
Monoline insurers
The Group has purchased protection from monoline insurers, mainly
against specific ABS, CDOs and CLOs. Monoline insurers are entities
which specialise in providing credit protection against the notional and
interest cash flows due to the holders of debt instruments in the event of
default by the debt security counterparty. This protection is typically
held in the form of derivatives such as credit default swaps (CDS)
referencing the underlying exposures held by the Group.
During the year the market value of securities protected by monoline
insurers continued to decline as markets deteriorated. As the fair value
of the protected assets declined, the fair value of the CDS protection from
monoline insurers increased. As the monoline insurers had concentrated
their exposures to credit market risks, their perceived credit quality has
deteriorated as concerns increased regarding the ability of these
counterparties to meet their contractual obligations. This resulted in
increased levels of CVA being recorded on the protection asset.
The change in exposure during the year has been driven by the
increased value of purchased derivative protection and the
strengthening of the US dollar against sterling as significantly all of the
exposures are US dollar denominated. The combination of greater
exposure and widening credit spreads has increased the level of CVA
required. Towards the end of the year the Group reached settlement on
a group of contracts with one monoline counterparty, thereby reducing
the overall exposure.
The covered bonds comprise asset-backed securities issued by several
Spanish financial institutions. These securities benefit from additional
credit enhancement provided by the issuing institutions. The other major
asset types that increased since 2007 include other consumer loans by
£1.8 billion, leases by £0.5 billion and student loans by £0.2 billion.
These and other increases were driven by the weakening of sterling
against the US dollar and euro.
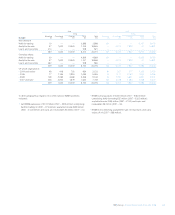
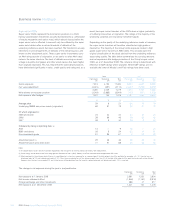
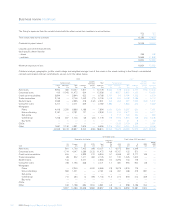
Other mortgage-related exposures (unaudited)
The Group’s whole loans and warehouse facilities collateralised by
mortgages are analysed below. These facilities primarily relate to UK
and European mortgages with US mortgages representing £260 million
of whole loans, of which more than 75% comprised prime mortgages.
2008 2007
Whole Warehouse Whole Warehouse
loans facilities loans facilities
£m £m £m £m
Prime 1,905 1,731 453 575
Commercial 1,262 409 2,200 900
Non-conforming 1,396 1019 57 1,445
Sub-prime 27 — 97 —
4,590 3,159 2,807 2,920
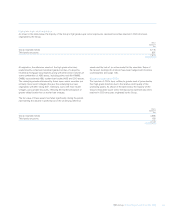
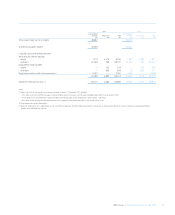
Counterparty valuation adjustments (audited)
Credit valuation adjustments
Credit valuation adjustments (CVAs) represent an estimate of the
adjustment to fair value that a market participant would make to
incorporate the credit risk inherent in counterparty derivative exposures.
During 2008, as credit spreads have widened, there has been a
significant increase in the CVA as set out in the table below.
2008 2007
£m £m
Monoline insurers 5,988 862
CDPCs 1,311 44
Other counterparties 1,738 263
Total CVA adjustments 9,037 1,169
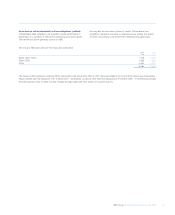
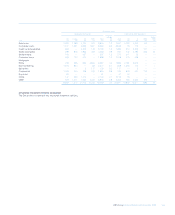
The tables below analyse the Group’s holdings of CDS with monoline counterparties.
2008 2007
£m £m
Gross exposure to monolines 11,581 3,409
Hedges with bank counterparties (789) —
Credit valuation adjustment (5,988) (862)
Net exposure to monolines 4,804 2,547