RBS 2008 Annual Report Download - page 40
Download and view the complete annual report
Please find page 40 of the 2008 RBS annual report below. You can navigate through the pages in the report by either clicking on the pages listed below, or by using the keyword search tool below to find specific information within the annual report.-
 1
1 -
2
-
3
-
4
-
5
-
6
-
7
-
8
-
9
-
10
-
11
-
12
-
13
-
14
-
15
-
16
-
17
-
18
-
19
-
20
-
21
-
22
-
23
-
24
-
25
-
26
-
27
-
28
-
29
-
 30
30 -
 31
31 -
 32
32 -
 33
33 -
 34
34 -
 35
35 -
 36
36 -
 37
37 -
 38
38 -
 39
39 -
 40
40 -
 41
41 -
 42
42 -
 43
43 -
 44
44 -
 45
45 -
 46
46 -
 47
47 -
 48
48 -
 49
49 -
 50
50 -
51
-
52
-
53
-
54
-
55
-
56
-
57
-
58
-
59
-
60
-
61
-
62
-
63
-
64
-
65
-
66
-
67
-
68
-
69
-
70
-
71
-
72
-
73
-
74
-
75
-
76
-
77
-
78
-
79
-
80
-
81
-
82
-
83
-
84
-
85
-
86
-
87
-
88
-
89
-
90
-
91
-
92
-
93
-
94
-
95
-
96
-
97
-
98
-
99
-
100
-
101
-
102
-
103
-
104
-
105
-
106
-
107
-
108
-
109
-
110
-
111
-
112
-
113
-
114
-
115
-
116
-
117
-
118
-
119
-
120
-
121
-
122
-
123
-
124
-
125
-
126
-
127
-
128
-
129
-
130
-
131
-
132
-
133
-
134
-
135
-
136
-
137
-
138
-
139
-
140
-
141
-
142
-
143
-
144
-
145
-
146
-
147
-
148
-
149
-
150
-
151
-
152
-
153
-
154
-
155
-
156
-
157
-
158
-
159
-
160
-
161
-
162
-
163
-
164
-
165
-
166
-
167
-
168
-
169
-
170
-
171
-
172
-
173
-
174
-
175
-
176
-
177
-
178
-
179
-
180
-
181
-
182
-
183
-
184
-
185
-
186
-
187
-
188
-
189
-
190
-
191
-
192
-
193
-
194
-
195
-
196
-
197
-
198
-
199
-
200
-
201
-
202
-
203
-
204
-
205
-
206
-
207
-
208
-
209
-
210
-
211
-
212
-
213
-
214
-
215
-
216
-
217
-
218
-
219
-
220
-
221
-
222
-
223
-
224
-
225
-
226
-
227
-
228
-
229
-
230
-
231
-
232
-
233
-
234
-
235
-
236
-
237
-
238
-
239
-
240
-
241
-
242
-
243
-
244
-
245
-
246
-
247
-
248
-
249
-
250
-
251
-
252
-
253
-
254
-
255
-
256
-
257
-
258
-
259
-
260
-
261
-
262
-
263
-
264
-
265
-
266
-
267
-
268
-
269
-
270
-
271
-
272
-
273
-
274
-
275
-
276
-
277
-
278
-
279
-
280
-
281
-
282
-
283
-
284
-
285
-
286
-
287
-
288
-
289
-
290
-
291
-
292
-
293
-
294
-
295
-
296
-
297
-
298
-
299
 |
 |

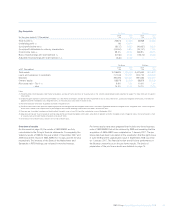
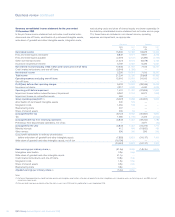
39RBS Group Annual Report and Accounts 2008
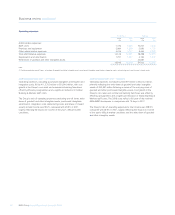
2008 compared with 2007 – statutory
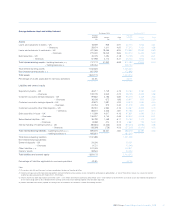
Loss
Loss before tax was £40,667 million compared with a profit of £9,832
million in 2007. The results have been adversely affected by credit
market write-downs of £7,781 million and write-down of goodwill and
other intangible assets of £32,581 million.
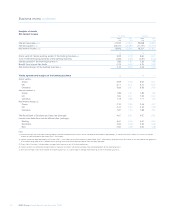
Total income
Total income was down 15% to £25,868 million, principally due to the
credit market write-downs.
Net interest income increased to £18,675 million and represents 72% of
total income (2007 – 40%).
Non-interest income decreased to £7,193 million principally due to the
credit market write-downs of £7,781 million offset by a movement in the
fair value of own debt of £1,232 million, and represents 28% of total
income (2007 – 60%).
Operating expenses
Operating expenses rose to £54,033 million. Integration and
restructuring costs were £1,357 million compared with £108 million in
2007. Write-down of goodwill and other intangible assets was £32,581
million.
Net insurance claims
Bancassurance and general insurance claims, after reinsurance,
decreased by 4% to £4,430 million.
Impairment losses
Impairment losses were £8,072 million, compared with £1,968 million
in 2007.
Risk elements in lending and potential problem loans represented
2.52% of gross loans and advances to customers excluding reverse
repos at 31 December 2008 (2007 – 1.64%).
Provision coverage of risk elements in lending and potential problem
loans was 51% (2007 – 57%).
Taxation
The effective tax rate for 2008 was 5.7% compared with 20.8% in 2007.
Earnings
Basic earnings per ordinary share decreased from 64.0p to a loss
of 145.7p.
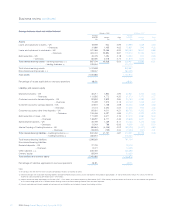
Balance sheet
Total assets of £2,401.7 billion at 31 December 2008 were up £560.8
billion, 30%, compared with 31 December 2007.
Loans and advances to banks decreased by £81.3 billion, 37%, to
£138.2 billion. Reverse repurchase agreements and stock borrowing
(‘reverse repos’) were down by £117.2 billion, 67% to £58.8 billion.
Excluding reverse repos, bank placings increased by £35.9 billion,
83%, to £79.4 billion.
Loans and advances to customers were up £46.2 billion, 6%, at £874.7
billion or £68.0 billion, 8% following the disposal of the Banco Real and
other businesses to Santander and Tesco Personal Finance. Within this,
reverse repos decreased by 72%, £103.0 billion to £39.3 billion.
Excluding reverse repos, lending rose by £149.2 billion, 22% to £835.4
billion reflecting both organic growth and the effect of exchange rate
movements following the weakening of sterling during the second half
of 2008.
Capital ratios at 31 December 2008 were 6.8% (Core Tier 1), 10.0%
(Tier 1) and 14.1% (Total).