RBS 2008 Annual Report Download - page 190
Download and view the complete annual report
Please find page 190 of the 2008 RBS annual report below. You can navigate through the pages in the report by either clicking on the pages listed below, or by using the keyword search tool below to find specific information within the annual report.-
 1
1 -
2
-
3
-
4
-
5
-
6
-
7
-
8
-
9
-
10
-
11
-
12
-
13
-
14
-
15
-
16
-
17
-
18
-
19
-
20
-
21
-
22
-
23
-
24
-
25
-
26
-
27
-
28
-
29
-
30
-
31
-
32
-
33
-
34
-
35
-
36
-
37
-
38
-
39
-
40
-
41
-
42
-
43
-
44
-
45
-
46
-
47
-
48
-
49
-
50
-
51
-
52
-
53
-
54
-
55
-
56
-
57
-
58
-
59
-
60
-
61
-
62
-
63
-
64
-
65
-
66
-
67
-
68
-
69
-
70
-
71
-
72
-
73
-
74
-
75
-
76
-
77
-
78
-
79
-
80
-
81
-
82
-
83
-
84
-
85
-
86
-
87
-
88
-
89
-
90
-
91
-
92
-
93
-
94
-
95
-
96
-
97
-
98
-
99
-
100
-
101
-
102
-
103
-
104
-
105
-
106
-
107
-
108
-
109
-
110
-
111
-
112
-
113
-
114
-
115
-
116
-
117
-
118
-
119
-
120
-
121
-
122
-
123
-
124
-
125
-
126
-
127
-
128
-
129
-
130
-
131
-
132
-
133
-
134
-
135
-
136
-
137
-
138
-
139
-
140
-
141
-
142
-
143
-
144
-
145
-
146
-
147
-
148
-
149
-
150
-
151
-
152
-
153
-
154
-
155
-
156
-
157
-
158
-
159
-
160
-
161
-
162
-
163
-
164
-
165
-
166
-
167
-
168
-
169
-
170
-
171
-
172
-
173
-
174
-
175
-
176
-
177
-
178
-
179
-
 180
180 -
 181
181 -
 182
182 -
 183
183 -
 184
184 -
 185
185 -
 186
186 -
 187
187 -
 188
188 -
 189
189 -
 190
190 -
 191
191 -
 192
192 -
 193
193 -
 194
194 -
 195
195 -
 196
196 -
 197
197 -
 198
198 -
 199
199 -
 200
200 -
201
-
202
-
203
-
204
-
205
-
206
-
207
-
208
-
209
-
210
-
211
-
212
-
213
-
214
-
215
-
216
-
217
-
218
-
219
-
220
-
221
-
222
-
223
-
224
-
225
-
226
-
227
-
228
-
229
-
230
-
231
-
232
-
233
-
234
-
235
-
236
-
237
-
238
-
239
-
240
-
241
-
242
-
243
-
244
-
245
-
246
-
247
-
248
-
249
-
250
-
251
-
252
-
253
-
254
-
255
-
256
-
257
-
258
-
259
-
260
-
261
-
262
-
263
-
264
-
265
-
266
-
267
-
268
-
269
-
270
-
271
-
272
-
273
-
274
-
275
-
276
-
277
-
278
-
279
-
280
-
281
-
282
-
283
-
284
-
285
-
286
-
287
-
288
-
289
-
290
-
291
-
292
-
293
-
294
-
295
-
296
-
297
-
298
-
299
 |
 |

Notes on the accounts
189RBS Group Annual Report and Accounts 2008
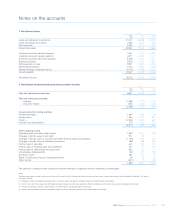
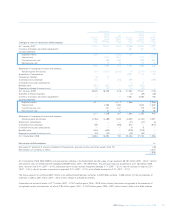
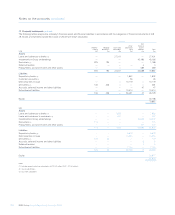
1Net interest income
Group
2008 2007 2006
£m £m £m
Loans and advances to customers 41,812 28,568 22,195
Loans and advances to banks 2,356 1,570 843
Debt securities 5,354 2,114 1,650
Interest receivable 49,522 32,252 24,688
Customer accounts: demand deposits 4,341 4,327 3,083
Customer accounts: savings deposits 3,911 2,560 1,373
Customer accounts: other time deposits 8,108 6,301 4,444
Deposits by banks 6,576 3,406 2,621
Debt securities in issue 9,941 5,687 3,286
Subordinated liabilities 2,144 1,530 1,386
Internal funding of trading business (4,174) (3,628) (2,101)
Interest payable 30,847 20,183 14,092
Net interest income 18,675 12,069 10,596
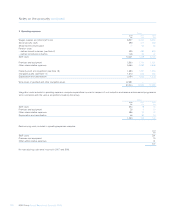
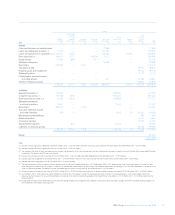
2 Non-interest income (excluding insurance premium income)
Group
2008 2007 2006
£m £m £m
Fees and commissions receivable 9,831 8,278 7,116
Fees and commissions payable:
– banking (1,985) (1,727) (1,432)
– insurance related (401) (466) (490)
(2,386) (2,193) (1,922)
(Loss)/income from trading activities:
Foreign exchange (1) 1,994 1,085 738
Interest rate (2) 1,454 1,414 973
Credit (3) (12,200) (1,446) 841
Equities and commodities (4) 275 239 123
(8,477) 1,292 2,675
Other operating income:
Operating lease and other rental income 1,525 1,671 1,755
Changes in the fair value of own debt 977 152 —
Changes in the fair value of securities and other financial assets and liabilities (1,730) 970 430
Changes in the fair value of investment properties (86) 288 486
Profit on sale of securities 342 544 369
Profit on sale of property, plant and equipment 167 741 216
Profit on sale of subsidiaries and associates 943 67 44
Life company (losses)/profits (52) 187 219
Dividend income 281 137 92
Share of profits less losses of associated entities 69 25 36
Other income (537) 51 (83)
1,899 4,833 3,564
The analysis of trading income is based on how the business is organised and the underlying risks managed.
Notes:
Trading income comprises gains and losses on financial instruments held for trading, both realised and unrealised, interest income and dividends and the related funding costs. The types of
instruments include:
(1) Foreign exchange: spot foreign exchange contracts, currency swaps and options, emerging markets and related hedges and funding.
(2) Interest rate: interest rate swaps, forward foreign exchange contracts, forward rate agreements, interest rate options, interest rate futures and related hedges and funding.
(3) Credit: asset-backed securities, corporate bonds, credit derivatives and related hedges and funding.
(4) Equities and commodities: equities, commodities, equity derivatives, commodity contracts and related hedges and funding.