RBS 2008 Annual Report Download - page 203
Download and view the complete annual report
Please find page 203 of the 2008 RBS annual report below. You can navigate through the pages in the report by either clicking on the pages listed below, or by using the keyword search tool below to find specific information within the annual report.-
 1
1 -
2
-
3
-
4
-
5
-
6
-
7
-
8
-
9
-
10
-
11
-
12
-
13
-
14
-
15
-
16
-
17
-
18
-
19
-
20
-
21
-
22
-
23
-
24
-
25
-
26
-
27
-
28
-
29
-
30
-
31
-
32
-
33
-
34
-
35
-
36
-
37
-
38
-
39
-
40
-
41
-
42
-
43
-
44
-
45
-
46
-
47
-
48
-
49
-
50
-
51
-
52
-
53
-
54
-
55
-
56
-
57
-
58
-
59
-
60
-
61
-
62
-
63
-
64
-
65
-
66
-
67
-
68
-
69
-
70
-
71
-
72
-
73
-
74
-
75
-
76
-
77
-
78
-
79
-
80
-
81
-
82
-
83
-
84
-
85
-
86
-
87
-
88
-
89
-
90
-
91
-
92
-
93
-
94
-
95
-
96
-
97
-
98
-
99
-
100
-
101
-
102
-
103
-
104
-
105
-
106
-
107
-
108
-
109
-
110
-
111
-
112
-
113
-
114
-
115
-
116
-
117
-
118
-
119
-
120
-
121
-
122
-
123
-
124
-
125
-
126
-
127
-
128
-
129
-
130
-
131
-
132
-
133
-
134
-
135
-
136
-
137
-
138
-
139
-
140
-
141
-
142
-
143
-
144
-
145
-
146
-
147
-
148
-
149
-
150
-
151
-
152
-
153
-
154
-
155
-
156
-
157
-
158
-
159
-
160
-
161
-
162
-
163
-
164
-
165
-
166
-
167
-
168
-
169
-
170
-
171
-
172
-
173
-
174
-
175
-
176
-
177
-
178
-
179
-
180
-
181
-
182
-
183
-
184
-
185
-
186
-
187
-
188
-
189
-
190
-
191
-
192
-
 193
193 -
 194
194 -
 195
195 -
 196
196 -
 197
197 -
 198
198 -
 199
199 -
 200
200 -
 201
201 -
 202
202 -
 203
203 -
 204
204 -
 205
205 -
 206
206 -
 207
207 -
 208
208 -
 209
209 -
 210
210 -
 211
211 -
 212
212 -
 213
213 -
214
-
215
-
216
-
217
-
218
-
219
-
220
-
221
-
222
-
223
-
224
-
225
-
226
-
227
-
228
-
229
-
230
-
231
-
232
-
233
-
234
-
235
-
236
-
237
-
238
-
239
-
240
-
241
-
242
-
243
-
244
-
245
-
246
-
247
-
248
-
249
-
250
-
251
-
252
-
253
-
254
-
255
-
256
-
257
-
258
-
259
-
260
-
261
-
262
-
263
-
264
-
265
-
266
-
267
-
268
-
269
-
270
-
271
-
272
-
273
-
274
-
275
-
276
-
277
-
278
-
279
-
280
-
281
-
282
-
283
-
284
-
285
-
286
-
287
-
288
-
289
-
290
-
291
-
292
-
293
-
294
-
295
-
296
-
297
-
298
-
299
 |
 |

Notes on the accounts continued
RBS Group Annual Report and Accounts 2008202
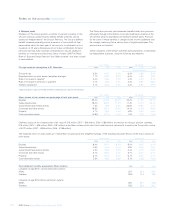
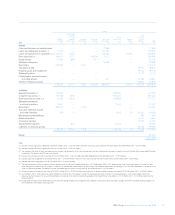
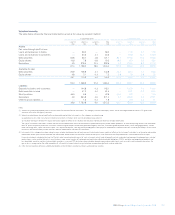
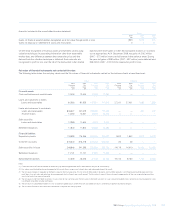
The tables below presents the Level 3 financial instruments carried at fair value as at the balance sheet date, valuation basis, main assumptions
used in the valuation of these instruments and reasonably possible increases or decreases in fair value based on reasonably possible alternative
assumptions:
Reasonably possible
alternative assumptions
Carrying Increase in Decrease in
Valuation basis/ Main value fair value fair value
Assets technique assumptions £bn £m £m
Loans and advances Proprietary model Credit spreads, indices 3.1 70 50
Debt securities:
– RMBS (1) Industry standard model Prepayment rates, probability of
default, loss severity and yield 0.5 40 90
– CMBS (2) Industry standard model Prepayment rates, probability of
default, loss severity and yield 0.6 30 30
– CDOs Proprietary model Implied collateral
valuation, defaults rates,
housing prices, correlation 1.7 410 440
– CLOs (3) Industry standard simulation model Credit spreads,
recovery rates, correlation 1.0 40 40
– Other Proprietary model Credit spreads 3.1 50 50
Derivatives
– credit Proprietary CVA model, industry Counterparty credit risk,
option models, correlation model correlation, volatility 8.0 1,030 1,200
– equity Proprietary model Volatility, correlation, dividends 0.1 — 10
– interest rate and commodity Proprietary model Volatility, correlation 2.2 130 130
Equity shares – private equity Valuation statements Fund valuations 1.1 80 160
31 December 2008 21.4 1,880 2,200
31 December 2007 32.7 610 700
Notes:
(1) Residential mortgage-backed securities.
(2) Commercial mortgage-backed securities.
(3) Collateralised loan obligations.
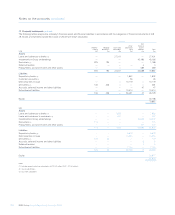
11 Financial instruments (continued)
Level 3 portfolios
Level 3 loans and advances decreased by £10 billion, primarily reflecting
reclassification of certain loans (leveraged finance and other corporate
loans) to loans and receivables (LAR) and fair value adjustments on the
remaining portfolio at the end of the year.
Debt securities categorised as level 3 at the end of the year include
£5.2 billion of asset-backed securities and £1.7 billion of corporate and
other debt securities. The decrease during the year reflects termination
of a deal in early 2008, reclassification of illiquid mortgage-backed
securities (MBS) to loans and receivables, fair value changes, and the
transfer of certain previous illiquid MBS, primarily sub-prime from level 3
to level 2.
Level 3 derivative assets at 31 December 2008 include credit derivative
trades with credit derivative product companies (CDPCs) with a fair
value of £3.5 billion after credit valuation adjustments of £1.3 billion.
At 31 December 2007 these credit derivative trades with CDPCs had a
fair value of £0.8 billion after a credit valuation of £44 million and were
included within level 2 of the fair value hierarchy. Other level 3 derivative
assets at 31 December 2008 include illiquid credit default swaps
(CDSs), other credit derivatives, commodity derivatives and illiquid
interest rate derivatives.
Debt securities in issue, categorised as level 3, were structured medium
term notes and the decrease in the year primarily reflects the termination
of a deal in the first half of 2008.