Bank of America 2014 Annual Report Download - page 100
Download and view the complete annual report
Please find page 100 of the 2014 Bank of America annual report below. You can navigate through the pages in the report by either clicking on the pages listed below, or by using the keyword search tool below to find specific information within the annual report.-
 1
1 -
2
-
3
-
4
-
5
-
6
-
7
-
8
-
9
-
10
-
11
-
12
-
13
-
14
-
15
-
16
-
17
-
18
-
19
-
20
-
21
-
22
-
23
-
24
-
25
-
26
-
27
-
28
-
29
-
30
-
31
-
32
-
33
-
34
-
35
-
36
-
37
-
38
-
39
-
40
-
41
-
42
-
43
-
44
-
45
-
46
-
47
-
48
-
49
-
50
-
51
-
52
-
53
-
54
-
55
-
56
-
57
-
58
-
59
-
60
-
61
-
62
-
63
-
64
-
65
-
66
-
67
-
68
-
69
-
70
-
71
-
72
-
73
-
74
-
75
-
76
-
77
-
78
-
79
-
80
-
81
-
82
-
83
-
84
-
85
-
86
-
87
-
88
-
89
-
 90
90 -
 91
91 -
 92
92 -
 93
93 -
 94
94 -
 95
95 -
 96
96 -
 97
97 -
 98
98 -
 99
99 -
 100
100 -
 101
101 -
 102
102 -
 103
103 -
 104
104 -
 105
105 -
 106
106 -
 107
107 -
 108
108 -
 109
109 -
 110
110 -
111
-
112
-
113
-
114
-
115
-
116
-
117
-
118
-
119
-
120
-
121
-
122
-
123
-
124
-
125
-
126
-
127
-
128
-
129
-
130
-
131
-
132
-
133
-
134
-
135
-
136
-
137
-
138
-
139
-
140
-
141
-
142
-
143
-
144
-
145
-
146
-
147
-
148
-
149
-
150
-
151
-
152
-
153
-
154
-
155
-
156
-
157
-
158
-
159
-
160
-
161
-
162
-
163
-
164
-
165
-
166
-
167
-
168
-
169
-
170
-
171
-
172
-
173
-
174
-
175
-
176
-
177
-
178
-
179
-
180
-
181
-
182
-
183
-
184
-
185
-
186
-
187
-
188
-
189
-
190
-
191
-
192
-
193
-
194
-
195
-
196
-
197
-
198
-
199
-
200
-
201
-
202
-
203
-
204
-
205
-
206
-
207
-
208
-
209
-
210
-
211
-
212
-
213
-
214
-
215
-
216
-
217
-
218
-
219
-
220
-
221
-
222
-
223
-
224
-
225
-
226
-
227
-
228
-
229
-
230
-
231
-
232
-
233
-
234
-
235
-
236
-
237
-
238
-
239
-
240
-
241
-
242
-
243
-
244
-
245
-
246
-
247
-
248
-
249
-
250
-
251
-
252
-
253
-
254
-
255
-
256
-
257
-
258
-
259
-
260
-
261
-
262
-
263
-
264
-
265
-
266
-
267
-
268
-
269
-
270
-
271
-
272
 |
 |
98 Bank of America 2014
Global Markets Risk Management continually reviews,
evaluates and enhances our VaR model so that it reflects the
material risks in our trading portfolio. Changes to the VaR model
are reviewed and approved prior to implementation and any
material changes are reported to management through the
appropriate management committees.
Trading limits on quantitative risk measures, including VaR, are
monitored on a daily basis. These trading limits are independently
set by Global Markets Risk Management and reviewed on a regular
basis to ensure they remain relevant and within our overall risk
appetite for market risks. Trading limits are reviewed in the context
of market liquidity, volatility and strategic business priorities.
Trading limits are set at both a granular level to ensure extensive
coverage of risks as well as at aggregated portfolios to account
for correlations among risk factors. All trading limits are approved
at least annually and the MRC has given authority to the GM
subcommittee to approve changes to trading limits throughout the
year. Approved trading limits are stored and tracked in a centralized
limits management system. Trading limit excesses are
communicated to management for review. Certain quantitative
market risk measures and corresponding limits have been
identified as critical in the Corporation’s Risk Appetite Statement.
These risk appetite limits are monitored on a daily basis and are
approved at least annually by the ERC and the Board.
In periods of market stress, the GM subcommittee members
communicate daily to discuss losses, key risk positions and any
limit excesses. As a result of this process, the businesses may
selectively reduce risk.
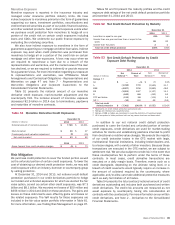
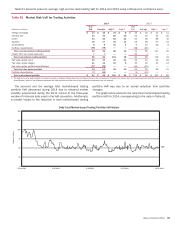
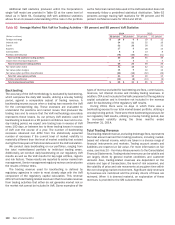
Market risk VaR for trading activities as presented in Table 61
differs from VaR used for regulatory capital calculations (regulatory
VaR). The VaR disclosed in Table 61 excludes both CVA, which are
adjustments to the mark-to-market value of our derivative
exposures to reflect the impact of the credit quality of
counterparties on our derivative assets, and the corresponding
hedges. Current regulatory standards require that regulatory VaR
only exclude CVA but include the corresponding hedges. The
holding period for regulatory VaR for capital calculations is 10 days,
while for the market risk VaR presented below, it is one day. Except
for the differences between regulatory and market risk VaR
regarding the inclusion of CVA hedges and the holding period, both
measures utilize the same process and methodology.
To provide visibility of market risks to which the Corporation is
exposed, Table 61 presents the total market-based trading
portfolio VaR which includes our total covered positions trading
portfolio and the impact from less liquid trading exposures.
Covered positions are defined by regulatory standards as trading
assets and liabilities, both on- and off-balance sheet, that meet a
defined set of specifications. These specifications identify the
most liquid trading positions which are intended to be held for a
short-term horizon and where the Corporation is able to hedge the
material risk elements in a two-way market. Positions in less liquid
markets, or where there are restrictions on the ability to trade the
positions, typically do not qualify as covered positions. Foreign
exchange and commodity positions are always considered covered
positions, except for structural foreign currency positions that we
choose to exclude with prior regulatory approval. Certain positions
related to our CVA and corresponding hedges are considered
covered positions; however, these are excluded from the VaR
results presented in Table 61. In addition, Table 61 presents our
fair value option portfolio, which includes the funded and unfunded
exposures for which we elect the fair value option, and their
corresponding hedges. The fair value option portfolio combined
with the total market-based trading portfolio VaR represents the
Corporation’s total market-based portfolio VaR. This population is
consistent with the risk appetite limits set by the ERC and the
Board.
The market risk across all business segments to which the
Corporation is exposed is included in the total market-based
portfolio VaR results. The majority of this portfolio is within the
Global Markets segment.