Bank of America 2014 Annual Report Download - page 37
Download and view the complete annual report
Please find page 37 of the 2014 Bank of America annual report below. You can navigate through the pages in the report by either clicking on the pages listed below, or by using the keyword search tool below to find specific information within the annual report.-
 1
1 -
2
-
3
-
4
-
5
-
6
-
7
-
8
-
9
-
10
-
11
-
12
-
13
-
14
-
15
-
16
-
17
-
18
-
19
-
20
-
21
-
22
-
23
-
24
-
25
-
26
-
 27
27 -
 28
28 -
 29
29 -
 30
30 -
 31
31 -
 32
32 -
 33
33 -
 34
34 -
 35
35 -
 36
36 -
 37
37 -
 38
38 -
 39
39 -
 40
40 -
 41
41 -
 42
42 -
 43
43 -
 44
44 -
 45
45 -
 46
46 -
 47
47 -
48
-
49
-
50
-
51
-
52
-
53
-
54
-
55
-
56
-
57
-
58
-
59
-
60
-
61
-
62
-
63
-
64
-
65
-
66
-
67
-
68
-
69
-
70
-
71
-
72
-
73
-
74
-
75
-
76
-
77
-
78
-
79
-
80
-
81
-
82
-
83
-
84
-
85
-
86
-
87
-
88
-
89
-
90
-
91
-
92
-
93
-
94
-
95
-
96
-
97
-
98
-
99
-
100
-
101
-
102
-
103
-
104
-
105
-
106
-
107
-
108
-
109
-
110
-
111
-
112
-
113
-
114
-
115
-
116
-
117
-
118
-
119
-
120
-
121
-
122
-
123
-
124
-
125
-
126
-
127
-
128
-
129
-
130
-
131
-
132
-
133
-
134
-
135
-
136
-
137
-
138
-
139
-
140
-
141
-
142
-
143
-
144
-
145
-
146
-
147
-
148
-
149
-
150
-
151
-
152
-
153
-
154
-
155
-
156
-
157
-
158
-
159
-
160
-
161
-
162
-
163
-
164
-
165
-
166
-
167
-
168
-
169
-
170
-
171
-
172
-
173
-
174
-
175
-
176
-
177
-
178
-
179
-
180
-
181
-
182
-
183
-
184
-
185
-
186
-
187
-
188
-
189
-
190
-
191
-
192
-
193
-
194
-
195
-
196
-
197
-
198
-
199
-
200
-
201
-
202
-
203
-
204
-
205
-
206
-
207
-
208
-
209
-
210
-
211
-
212
-
213
-
214
-
215
-
216
-
217
-
218
-
219
-
220
-
221
-
222
-
223
-
224
-
225
-
226
-
227
-
228
-
229
-
230
-
231
-
232
-
233
-
234
-
235
-
236
-
237
-
238
-
239
-
240
-
241
-
242
-
243
-
244
-
245
-
246
-
247
-
248
-
249
-
250
-
251
-
252
-
253
-
254
-
255
-
256
-
257
-
258
-
259
-
260
-
261
-
262
-
263
-
264
-
265
-
266
-
267
-
268
-
269
-
270
-
271
-
272
 |
 |

Bank of America 2014 35
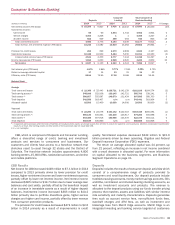
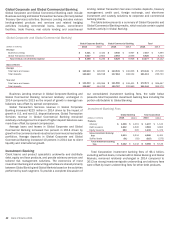
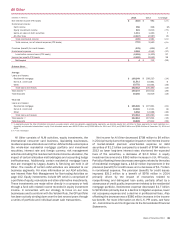
Consumer Real Estate Services
Home Loans
Legacy Assets &
Servicing
Total Consumer Real
Estate Services
(Dollars in millions) 2014 2013 2014 2013 2014 2013 % Change
Net interest income (FTE basis) $ 1,315 $ 1,349 $ 1,516 $ 1,541 $ 2,831 $ 2,890 (2)%
Noninterest income:
Mortgage banking income 813 1,916 1,053 2,669 1,866 4,585 (59)
All other income (loss) 40 (6) 111 246 151 240 (37)
Total noninterest income 853 1,910 1,164 2,915 2,017 4,825 (58)
Total revenue, net of interest expense (FTE basis) 2,168 3,259 2,680 4,456 4,848 7,715 (37)
Provision for credit losses 33 127 127 (283) 160 (156) n/m
Noninterest expense 2,587 3,334 20,639 12,481 23,226 15,815 47
Loss before income taxes (FTE basis) (452) (202) (18,086) (7,742) (18,538) (7,944) 133
Income tax benefit (FTE basis) (169) (74) (4,974)(2,839) (5,143)(2,913) 77
Net loss $ (283) $ (128) $ (13,112) $ (4,903) $ (13,395) $ (5,031) n/m
Net interest yield (FTE basis) 2.40% 2.54% 4.03%3.19% 3.06%2.85%
Balance Sheet
Average
Total loans and leases $ 52,336 $ 47,675 $ 35,941 $ 42,603 $88,277 $ 90,278 (2)
Total earning assets 54,778 53,148 37,593 48,272 92,371 101,420 (9)
Total assets 54,751 53,426 52,134 67,130 106,885 120,556 (11)
Allocated capital 6,000 6,000 17,000 18,000 23,000 24,000 (4)
Year end
Total loans and leases $ 54,917 $ 51,021 $ 33,055 $ 38,732 $87,972 $ 89,753 (2)
Total earning assets 57,881 54,071 33,922 43,092 91,803 97,163 (6)
Total assets 57,772 53,933 45,958 59,458 103,730 113,391 (9)
n/m = not meaningful
CRES operations include Home Loans and Legacy Assets &
Servicing. Home Loans is responsible for ongoing residential first
mortgage and home equity loan production activities and the CRES
home equity loan portfolio not selected for inclusion in the Legacy
Assets & Servicing owned portfolio. Legacy Assets & Servicing is
responsible for our mortgage servicing activities related to loans
serviced for others and loans held by the Corporation, including
loans that have been designated as the Legacy Assets & Servicing
Portfolios. The Legacy Assets & Servicing Portfolios (both owned
and serviced), herein referred to as the Legacy Owned and Legacy
Serviced Portfolios, respectively (together, the Legacy Portfolios),
and as further defined below, include those loans originated prior
to January 1, 2011 that would not have been originated under our
established underwriting standards as of December 31, 2010. For
more information on our Legacy Portfolios, see page 36. In
addition, Legacy Assets & Servicing is responsible for managing
legacy exposures related to CRES (e.g., litigation, representations
and warranties). This alignment allows CRES management to lead
the ongoing Home Loans business while also providing focus on
legacy mortgage issues and servicing activities.
CRES, primarily through its Home Loans operations, generates
revenue by providing an extensive line of consumer real estate
products and services to customers nationwide. CRES products
offered by Home Loans include fixed- and adjustable-rate first-lien
mortgage loans for home purchase and refinancing needs, home
equity lines of credit (HELOCs) and home equity loans. First
mortgage products are generally either sold into the secondary
mortgage market to investors, while we retain MSRs (which are
on the balance sheet of Legacy Assets & Servicing) and the Bank
of America customer relationships, or are held on the balance
sheet in Home Loans or in All Other for ALM purposes. Home Loans
is compensated for loans held for ALM purposes on a management
accounting basis with the corresponding offset in All Other. Newly
originated HELOCs and home equity loans are retained on the
CRES balance sheet in Home Loans.
CRES includes the impact of migrating certain customers and
their related loan balances from GWIM to CRES. For more
information on the migration of customer balances to or from
GWIM, see GWIM on page 39.
CRES Results
The net loss for CRES increased $8.4 billion to a net loss of $13.4
billion for 2014 compared to 2013 primarily driven by higher
litigation expense, which is included in noninterest expense, as a
result of the settlements with the DoJ and FHFA, a lower tax benefit
rate resulting from the non-deductible treatment of a portion of
the settlement with the DoJ, lower mortgage banking income and
higher provision for credit losses.
Mortgage banking income decreased $2.7 billion due to both
lower servicing income and core production revenue, partially
offset by a lower representations and warranties provision. The
provision for credit losses increased $316 million to $160 million
driven by additional costs associated with the consumer relief
portion of the settlement with the DoJ, partially offset by the
continued improvement in portfolio trends including increased
home prices. Noninterest expense increased $7.4 billion primarily
due to a $11.4 billion increase in litigation expense as a result of
the settlements with the DoJ and FHFA. Excluding litigation,