Bank of America 2014 Annual Report Download - page 169
Download and view the complete annual report
Please find page 169 of the 2014 Bank of America annual report below. You can navigate through the pages in the report by either clicking on the pages listed below, or by using the keyword search tool below to find specific information within the annual report.-
 1
1 -
2
-
3
-
4
-
5
-
6
-
7
-
8
-
9
-
10
-
11
-
12
-
13
-
14
-
15
-
16
-
17
-
18
-
19
-
20
-
21
-
22
-
23
-
24
-
25
-
26
-
27
-
28
-
29
-
30
-
31
-
32
-
33
-
34
-
35
-
36
-
37
-
38
-
39
-
40
-
41
-
42
-
43
-
44
-
45
-
46
-
47
-
48
-
49
-
50
-
51
-
52
-
53
-
54
-
55
-
56
-
57
-
58
-
59
-
60
-
61
-
62
-
63
-
64
-
65
-
66
-
67
-
68
-
69
-
70
-
71
-
72
-
73
-
74
-
75
-
76
-
77
-
78
-
79
-
80
-
81
-
82
-
83
-
84
-
85
-
86
-
87
-
88
-
89
-
90
-
91
-
92
-
93
-
94
-
95
-
96
-
97
-
98
-
99
-
100
-
101
-
102
-
103
-
104
-
105
-
106
-
107
-
108
-
109
-
110
-
111
-
112
-
113
-
114
-
115
-
116
-
117
-
118
-
119
-
120
-
121
-
122
-
123
-
124
-
125
-
126
-
127
-
128
-
129
-
130
-
131
-
132
-
133
-
134
-
135
-
136
-
137
-
138
-
139
-
140
-
141
-
142
-
143
-
144
-
145
-
146
-
147
-
148
-
149
-
150
-
151
-
152
-
153
-
154
-
155
-
156
-
157
-
158
-
 159
159 -
 160
160 -
 161
161 -
 162
162 -
 163
163 -
 164
164 -
 165
165 -
 166
166 -
 167
167 -
 168
168 -
 169
169 -
 170
170 -
 171
171 -
 172
172 -
 173
173 -
 174
174 -
 175
175 -
 176
176 -
 177
177 -
 178
178 -
 179
179 -
180
-
181
-
182
-
183
-
184
-
185
-
186
-
187
-
188
-
189
-
190
-
191
-
192
-
193
-
194
-
195
-
196
-
197
-
198
-
199
-
200
-
201
-
202
-
203
-
204
-
205
-
206
-
207
-
208
-
209
-
210
-
211
-
212
-
213
-
214
-
215
-
216
-
217
-
218
-
219
-
220
-
221
-
222
-
223
-
224
-
225
-
226
-
227
-
228
-
229
-
230
-
231
-
232
-
233
-
234
-
235
-
236
-
237
-
238
-
239
-
240
-
241
-
242
-
243
-
244
-
245
-
246
-
247
-
248
-
249
-
250
-
251
-
252
-
253
-
254
-
255
-
256
-
257
-
258
-
259
-
260
-
261
-
262
-
263
-
264
-
265
-
266
-
267
-
268
-
269
-
270
-
271
-
272
 |
 |

Bank of America 2014 167
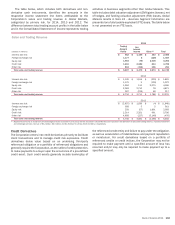
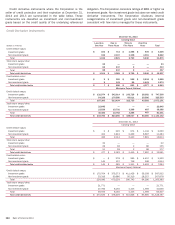
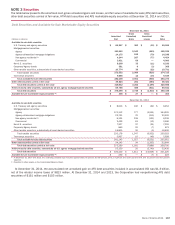
NOTE 3 Securities
The table below presents the amortized cost, gross unrealized gains and losses, and fair value of available-for-sale (AFS) debt securities,
other debt securities carried at fair value, HTM debt securities and AFS marketable equity securities at December 31, 2014 and 2013.
Debt Securities and Available-for-Sale Marketable Equity Securities
December 31, 2014
(Dollars in millions)
Amortized
Cost
Gross
Unrealized
Gains
Gross
Unrealized
Losses
Fair
Value
Available-for-sale debt securities
U.S. Treasury and agency securities $ 69,267 $ 360 $ (32) $ 69,595
Mortgage-backed securities:
Agency 163,592 2,040 (593) 165,039
Agency-collateralized mortgage obligations 14,175 152 (79) 14,248
Non-agency residential (1) 4,244 287 (77) 4,454
Commercial 3,931 69 —4,000
Non-U.S. securities 6,208 33 (11) 6,230
Corporate/Agency bonds 361 9(2) 368
Other taxable securities, substantially all asset-backed securities 10,774 39 (22) 10,791
Total taxable securities 272,552 2,989 (816) 274,725
Tax-exempt securities 9,556 12 (19) 9,549
Total available-for-sale debt securities 282,108 3,001 (835) 284,274
Other debt securities carried at fair value 36,524 261 (364) 36,421
Total debt securities carried at fair value 318,632 3,262 (1,199) 320,695
Held-to-maturity debt securities, substantially all U.S. agency mortgage-backed securities 59,766 486 (611) 59,641
Total debt securities $ 378,398 $ 3,748 $ (1,810) $ 380,336
Available-for-sale marketable equity securities (2) $336 $27$ —$ 363
December 31, 2013
Available-for-sale debt securities
U.S. Treasury and agency securities $ 8,910 $ 106 $ (62) $ 8,954
Mortgage-backed securities:
Agency 170,112 777 (5,954) 164,935
Agency-collateralized mortgage obligations 22,731 76 (315) 22,492
Non-agency residential (1) 6,124 238 (123) 6,239
Commercial 2,429 63 (12) 2,480
Non-U.S. securities 7,207 37 (24) 7,220
Corporate/Agency bonds 860 20 (7) 873
Other taxable securities, substantially all asset-backed securities 16,805 30 (5) 16,830
Total taxable securities 235,178 1,347 (6,502) 230,023
Tax-exempt securities 5,967 10 (49) 5,928
Total available-for-sale debt securities 241,145 1,357 (6,551) 235,951
Other debt securities carried at fair value 34,145 34 (1,335) 32,844
Total debt securities carried at fair value 275,290 1,391 (7,886) 268,795
Held-to-maturity debt securities, substantially all U.S. agency mortgage-backed securities 55,150 20 (2,740) 52,430
Total debt securities $ 330,440 $ 1,411 $ (10,626) $ 321,225
Available-for-sale marketable equity securities (2) $ 230 $ — $ (7) $ 223
(1) At December 31, 2014 and 2013, the underlying collateral type included approximately 76 percent and 89 percent prime, 14 percent and seven percent Alt-A, and 10 percent and four percent
subprime.
(2) Classified in other assets on the Consolidated Balance Sheet.
At December 31, 2014, the accumulated net unrealized gain on AFS debt securities included in accumulated OCI was $1.3 billion,
net of the related income taxes of $823 million. At December 31, 2014 and 2013, the Corporation had nonperforming AFS debt
securities of $161 million and $103 million.