Bank of America 2014 Annual Report Download - page 46
Download and view the complete annual report
Please find page 46 of the 2014 Bank of America annual report below. You can navigate through the pages in the report by either clicking on the pages listed below, or by using the keyword search tool below to find specific information within the annual report.-
 1
1 -
2
-
3
-
4
-
5
-
6
-
7
-
8
-
9
-
10
-
11
-
12
-
13
-
14
-
15
-
16
-
17
-
18
-
19
-
20
-
21
-
22
-
23
-
24
-
25
-
26
-
27
-
28
-
29
-
30
-
31
-
32
-
33
-
34
-
35
-
 36
36 -
 37
37 -
 38
38 -
 39
39 -
 40
40 -
 41
41 -
 42
42 -
 43
43 -
 44
44 -
 45
45 -
 46
46 -
 47
47 -
 48
48 -
 49
49 -
 50
50 -
 51
51 -
 52
52 -
 53
53 -
 54
54 -
 55
55 -
 56
56 -
57
-
58
-
59
-
60
-
61
-
62
-
63
-
64
-
65
-
66
-
67
-
68
-
69
-
70
-
71
-
72
-
73
-
74
-
75
-
76
-
77
-
78
-
79
-
80
-
81
-
82
-
83
-
84
-
85
-
86
-
87
-
88
-
89
-
90
-
91
-
92
-
93
-
94
-
95
-
96
-
97
-
98
-
99
-
100
-
101
-
102
-
103
-
104
-
105
-
106
-
107
-
108
-
109
-
110
-
111
-
112
-
113
-
114
-
115
-
116
-
117
-
118
-
119
-
120
-
121
-
122
-
123
-
124
-
125
-
126
-
127
-
128
-
129
-
130
-
131
-
132
-
133
-
134
-
135
-
136
-
137
-
138
-
139
-
140
-
141
-
142
-
143
-
144
-
145
-
146
-
147
-
148
-
149
-
150
-
151
-
152
-
153
-
154
-
155
-
156
-
157
-
158
-
159
-
160
-
161
-
162
-
163
-
164
-
165
-
166
-
167
-
168
-
169
-
170
-
171
-
172
-
173
-
174
-
175
-
176
-
177
-
178
-
179
-
180
-
181
-
182
-
183
-
184
-
185
-
186
-
187
-
188
-
189
-
190
-
191
-
192
-
193
-
194
-
195
-
196
-
197
-
198
-
199
-
200
-
201
-
202
-
203
-
204
-
205
-
206
-
207
-
208
-
209
-
210
-
211
-
212
-
213
-
214
-
215
-
216
-
217
-
218
-
219
-
220
-
221
-
222
-
223
-
224
-
225
-
226
-
227
-
228
-
229
-
230
-
231
-
232
-
233
-
234
-
235
-
236
-
237
-
238
-
239
-
240
-
241
-
242
-
243
-
244
-
245
-
246
-
247
-
248
-
249
-
250
-
251
-
252
-
253
-
254
-
255
-
256
-
257
-
258
-
259
-
260
-
261
-
262
-
263
-
264
-
265
-
266
-
267
-
268
-
269
-
270
-
271
-
272
 |
 |

44 Bank of America 2014
Year-end loans and leases decreased $8.0 billion in 2014 due
to a decrease in low-margin prime brokerage loans.
The return on average allocated capital was eight percent, up
from four percent, largely driven by higher net income, partially
offset by an increase in allocated capital. Excluding net DVA/FVA
and charges in 2013 related to the U.K. corporate income tax rate
reduction, the return on average allocated capital was eight
percent, a decrease from 10 percent, driven by lower net income,
excluding net DVA/FVA and the tax change, and an increase in
allocated capital.
Sales and Trading Revenue
Sales and trading revenue includes unrealized and realized gains
and losses on trading and other assets, net interest income, and
fees primarily from commissions on equity securities. Sales and
trading revenue is segregated into fixed income (government debt
obligations, investment and non-investment grade corporate debt
obligations, commercial mortgage-backed securities, residential
mortgage-backed securities (RMBS), collateralized loan
obligations (CLOs), interest rate and credit derivative contracts),
currencies (interest rate and foreign exchange contracts),
commodities (primarily futures, forwards, swaps and options) and
equities (equity-linked derivatives and cash equity activity). The
following table and related discussion present sales and trading
revenue, substantially all of which is in Global Markets, with the
remainder in Global Banking. In addition, the following table and
related discussion present sales and trading revenue excluding
the impact of net DVA/FVA, which is a non-GAAP financial measure.
We believe the use of this non-GAAP financial measure provides
clarity in assessing the underlying performance of these
businesses.
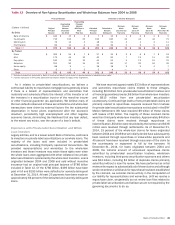
Sales and Trading Revenue (1, 2)
(Dollars in millions) 2014 2013
Sales and trading revenue
Fixed income, currencies and commodities $ 8,706 $ 8,231
Equities 4,215 4,180
Total sales and trading revenue $ 12,921 $ 12,411
Sales and trading revenue, excluding net DVA/FVA (3)
Fixed income, currencies and commodities $ 9,013 $ 9,345
Equities 4,148 4,224
Total sales and trading revenue, excluding
net DVA/FVA $ 13,161 $ 13,569
(1) Includes FTE adjustments of $181 million and $180 million for 2014 and 2013. For more
information on sales and trading revenue, see Note 2 – Derivatives to the Consolidated Financial
Statements.
(2) Includes Global Banking sales and trading revenue of $382 million and $385 million for 2014
and 2013.
(3) FICC and Equities sales and trading revenue, excluding the impact of net DVA and FVA, is a non-
GAAP financial measure. FICC net DVA/FVA losses were $307 million for 2014 compared to
net DVA losses of $1.1 billion in 2013. Equities net DVA/FVA gains were $67 million for 2014
compared to net DVA losses of $44 million in 2013.
Fixed-income, currency and commodities (FICC) revenue,
excluding net DVA/FVA, decreased $332 million to $9.0 billion
driven by declines in the rates and credit-related businesses due
to both lower market volumes and volatility, partially offset by
improvement in the commodities business. The prior year included
a $450 million write-down of a monoline receivable related to the
settlement of a legacy matter. Equities revenue, excluding net DVA/
FVA, decreased $76 million to $4.1 billion due to financing
additional liquid asset buffers, pursuant to current regulatory
requirements, primarily in our broker-dealer entities, which also
negatively impacted FICC results.