Bank of America 2014 Annual Report Download - page 258
Download and view the complete annual report
Please find page 258 of the 2014 Bank of America annual report below. You can navigate through the pages in the report by either clicking on the pages listed below, or by using the keyword search tool below to find specific information within the annual report.-
 1
1 -
2
-
3
-
4
-
5
-
6
-
7
-
8
-
9
-
10
-
11
-
12
-
13
-
14
-
15
-
16
-
17
-
18
-
19
-
20
-
21
-
22
-
23
-
24
-
25
-
26
-
27
-
28
-
29
-
30
-
31
-
32
-
33
-
34
-
35
-
36
-
37
-
38
-
39
-
40
-
41
-
42
-
43
-
44
-
45
-
46
-
47
-
48
-
49
-
50
-
51
-
52
-
53
-
54
-
55
-
56
-
57
-
58
-
59
-
60
-
61
-
62
-
63
-
64
-
65
-
66
-
67
-
68
-
69
-
70
-
71
-
72
-
73
-
74
-
75
-
76
-
77
-
78
-
79
-
80
-
81
-
82
-
83
-
84
-
85
-
86
-
87
-
88
-
89
-
90
-
91
-
92
-
93
-
94
-
95
-
96
-
97
-
98
-
99
-
100
-
101
-
102
-
103
-
104
-
105
-
106
-
107
-
108
-
109
-
110
-
111
-
112
-
113
-
114
-
115
-
116
-
117
-
118
-
119
-
120
-
121
-
122
-
123
-
124
-
125
-
126
-
127
-
128
-
129
-
130
-
131
-
132
-
133
-
134
-
135
-
136
-
137
-
138
-
139
-
140
-
141
-
142
-
143
-
144
-
145
-
146
-
147
-
148
-
149
-
150
-
151
-
152
-
153
-
154
-
155
-
156
-
157
-
158
-
159
-
160
-
161
-
162
-
163
-
164
-
165
-
166
-
167
-
168
-
169
-
170
-
171
-
172
-
173
-
174
-
175
-
176
-
177
-
178
-
179
-
180
-
181
-
182
-
183
-
184
-
185
-
186
-
187
-
188
-
189
-
190
-
191
-
192
-
193
-
194
-
195
-
196
-
197
-
198
-
199
-
200
-
201
-
202
-
203
-
204
-
205
-
206
-
207
-
208
-
209
-
210
-
211
-
212
-
213
-
214
-
215
-
216
-
217
-
218
-
219
-
220
-
221
-
222
-
223
-
224
-
225
-
226
-
227
-
228
-
229
-
230
-
231
-
232
-
233
-
234
-
235
-
236
-
237
-
238
-
239
-
240
-
241
-
242
-
243
-
244
-
245
-
246
-
247
-
 248
248 -
 249
249 -
 250
250 -
 251
251 -
 252
252 -
 253
253 -
 254
254 -
 255
255 -
 256
256 -
 257
257 -
 258
258 -
 259
259 -
 260
260 -
 261
261 -
 262
262 -
 263
263 -
 264
264 -
 265
265 -
 266
266 -
 267
267 -
 268
268 -
269
-
270
-
271
-
272
 |
 |

256 Bank of America 2014
funds sold and purchased are classified as Level 2. Resale and
repurchase agreements are classified as Level 2 because they
are generally short-dated and/or variable-rate instruments
collateralized by U.S. government or agency securities. Customer
and other receivables primarily consist of margin loans, servicing
advances and other accounts receivable and are classified as
Level 2 and Level 3. Customer payables and short-term borrowings
are classified as Level 2.
Held-to-maturity Debt Securities
HTM debt securities, which consist primarily of U.S. agency debt
securities, are classified as Level 2 using the same methodologies
as AFS U.S. agency debt securities. For more information on HTM
debt securities, see Note 3 – Securities.
Loans
The fair values for commercial and consumer loans are generally
determined by discounting both principal and interest cash flows
expected to be collected using a discount rate for similar
instruments with adjustments that the Corporation believes a
market participant would consider in determining fair value. The
Corporation estimates the cash flows expected to be collected
using internal credit risk, interest rate and prepayment risk models
that incorporate the Corporation’s best estimate of current key
assumptions, such as default rates, loss severity and prepayment
speeds for the life of the loan. The carrying value of loans is
presented net of the applicable allowance for loan losses and
excludes leases. The Corporation accounts for certain commercial
loans and residential mortgage loans under the fair value option.
Deposits
The fair value for certain deposits with stated maturities was
determined by discounting contractual cash flows using current
market rates for instruments with similar maturities. The carrying
value of non-U.S. time deposits approximates fair value. For
deposits with no stated maturities, the carrying value was
considered to approximate fair value and does not take into
account the significant value of the cost advantage and stability
of the Corporation’s long-term relationships with depositors. The
Corporation accounts for certain long-term fixed-rate deposits
under the fair value option.
Long-term Debt
The Corporation uses quoted market prices, when available, to
estimate fair value for its long-term debt. When quoted market
prices are not available, fair value is estimated based on current
market interest rates and credit spreads for debt with similar terms
and maturities. The Corporation accounts for certain structured
liabilities under the fair value option.
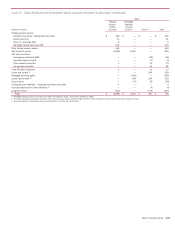
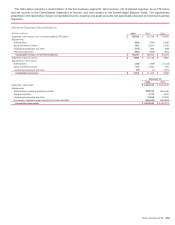
Fair Value of Financial Instruments
The carrying values and fair values by fair value hierarchy of certain
financial instruments where only a portion of the ending balance
was carried at fair value at December 31, 2014 and 2013 are
presented in the table below.
Fair Value of Financial Instruments
December 31, 2014
Fair Value
(Dollars in millions)
Carrying
Value Level 2 Level 3 Total
Financial assets
Loans $ 842,259 $ 87,174 $ 776,370 $ 863,544
Loans held-for-sale 12,836 12,236 618 12,854
Financial liabilities
Deposits 1,118,936 1,119,427 — 1,119,427
Long-term debt 243,139 249,692 2,362 252,054
December 31, 2013
Financial assets
Loans $ 885,724 $ 102,564 $ 789,273 $ 891,837
Loans held-for-sale 11,362 8,872 2,613 11,485
Financial liabilities
Deposits 1,119,271 1,119,512 — 1,119,512
Long-term debt 249,674 257,402 1,990 259,392
Commercial Unfunded Lending Commitments
Fair values were generally determined using a discounted cash
flow valuation approach which is applied using market-based CDS
or internally developed benchmark credit curves. The Corporation
accounts for certain loan commitments under the fair value option.
The carrying values and fair values of the Corporation’s
commercial unfunded lending commitments were $932 million and
$3.8 billion at December 31, 2014, and $830 million and $3.7
billion at December 31, 2013. Commercial unfunded lending
commitments are primarily classified as Level 3. The carrying value
of these commitments is classified in accrued expenses and other
liabilities.
The Corporation does not estimate the fair values of consumer
unfunded lending commitments because, in many instances, the
Corporation can reduce or cancel these commitments by providing
notice to the borrower. For more information on commitments, see
Note 12 – Commitments and Contingencies.