Bank of America 2014 Annual Report Download - page 263
Download and view the complete annual report
Please find page 263 of the 2014 Bank of America annual report below. You can navigate through the pages in the report by either clicking on the pages listed below, or by using the keyword search tool below to find specific information within the annual report.-
 1
1 -
2
-
3
-
4
-
5
-
6
-
7
-
8
-
9
-
10
-
11
-
12
-
13
-
14
-
15
-
16
-
17
-
18
-
19
-
20
-
21
-
22
-
23
-
24
-
25
-
26
-
27
-
28
-
29
-
30
-
31
-
32
-
33
-
34
-
35
-
36
-
37
-
38
-
39
-
40
-
41
-
42
-
43
-
44
-
45
-
46
-
47
-
48
-
49
-
50
-
51
-
52
-
53
-
54
-
55
-
56
-
57
-
58
-
59
-
60
-
61
-
62
-
63
-
64
-
65
-
66
-
67
-
68
-
69
-
70
-
71
-
72
-
73
-
74
-
75
-
76
-
77
-
78
-
79
-
80
-
81
-
82
-
83
-
84
-
85
-
86
-
87
-
88
-
89
-
90
-
91
-
92
-
93
-
94
-
95
-
96
-
97
-
98
-
99
-
100
-
101
-
102
-
103
-
104
-
105
-
106
-
107
-
108
-
109
-
110
-
111
-
112
-
113
-
114
-
115
-
116
-
117
-
118
-
119
-
120
-
121
-
122
-
123
-
124
-
125
-
126
-
127
-
128
-
129
-
130
-
131
-
132
-
133
-
134
-
135
-
136
-
137
-
138
-
139
-
140
-
141
-
142
-
143
-
144
-
145
-
146
-
147
-
148
-
149
-
150
-
151
-
152
-
153
-
154
-
155
-
156
-
157
-
158
-
159
-
160
-
161
-
162
-
163
-
164
-
165
-
166
-
167
-
168
-
169
-
170
-
171
-
172
-
173
-
174
-
175
-
176
-
177
-
178
-
179
-
180
-
181
-
182
-
183
-
184
-
185
-
186
-
187
-
188
-
189
-
190
-
191
-
192
-
193
-
194
-
195
-
196
-
197
-
198
-
199
-
200
-
201
-
202
-
203
-
204
-
205
-
206
-
207
-
208
-
209
-
210
-
211
-
212
-
213
-
214
-
215
-
216
-
217
-
218
-
219
-
220
-
221
-
222
-
223
-
224
-
225
-
226
-
227
-
228
-
229
-
230
-
231
-
232
-
233
-
234
-
235
-
236
-
237
-
238
-
239
-
240
-
241
-
242
-
243
-
244
-
245
-
246
-
247
-
248
-
249
-
250
-
251
-
252
-
 253
253 -
 254
254 -
 255
255 -
 256
256 -
 257
257 -
 258
258 -
 259
259 -
 260
260 -
 261
261 -
 262
262 -
 263
263 -
 264
264 -
 265
265 -
 266
266 -
 267
267 -
 268
268 -
 269
269 -
 270
270 -
 271
271 -
 272
272
 |
 |

Bank of America 2014 261
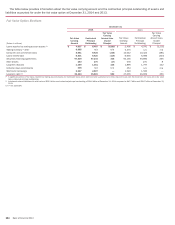
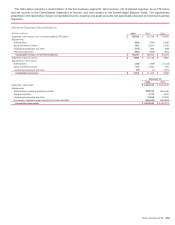
The table below presents a reconciliation of the five business segments’ total revenue, net of interest expense, on an FTE basis,
and net income to the Consolidated Statement of Income, and total assets to the Consolidated Balance Sheet. The adjustments
presented in the table below include consolidated income, expense and asset amounts not specifically allocated to individual business
segments.
Business Segment Reconciliations
(Dollars in millions) 2014 2013 2012
Segments’ total revenue, net of interest expense (FTE basis) $ 85,831 $ 87,238 $ 79,895
Adjustments:
ALM activities (804) (545) 2,266
Equity investment income 601 2,610 1,136
Liquidating businesses and other (512) 498 938
FTE basis adjustment (869) (859) (901)
Consolidated revenue, net of interest expense $ 84,247 $ 88,942 $ 83,334
Segments’ total net income $ 4,829 $ 10,719 $ 4,891
Adjustments, net of taxes:
ALM activities (343) (929) (1,144)
Equity investment income 376 1,644 716
Liquidating businesses and other (29) (3) (275)
Consolidated net income $ 4,833 $ 11,431 $ 4,188
December 31
2014 2013
Segments’ total assets $1,961,722 $ 1,934,649
Adjustments:
ALM activities, including securities portfolio 658,319 664,530
Equity investments 1,770 2,426
Liquidating businesses and other 72,638 70,470
Elimination of segment asset allocations to match liabilities (589,915)(569,802)
Consolidated total assets $ 2,104,534 $ 2,102,273