Bank of America 2014 Annual Report Download - page 41
Download and view the complete annual report
Please find page 41 of the 2014 Bank of America annual report below. You can navigate through the pages in the report by either clicking on the pages listed below, or by using the keyword search tool below to find specific information within the annual report.-
 1
1 -
2
-
3
-
4
-
5
-
6
-
7
-
8
-
9
-
10
-
11
-
12
-
13
-
14
-
15
-
16
-
17
-
18
-
19
-
20
-
21
-
22
-
23
-
24
-
25
-
26
-
27
-
28
-
29
-
30
-
 31
31 -
 32
32 -
 33
33 -
 34
34 -
 35
35 -
 36
36 -
 37
37 -
 38
38 -
 39
39 -
 40
40 -
 41
41 -
 42
42 -
 43
43 -
 44
44 -
 45
45 -
 46
46 -
 47
47 -
 48
48 -
 49
49 -
 50
50 -
 51
51 -
52
-
53
-
54
-
55
-
56
-
57
-
58
-
59
-
60
-
61
-
62
-
63
-
64
-
65
-
66
-
67
-
68
-
69
-
70
-
71
-
72
-
73
-
74
-
75
-
76
-
77
-
78
-
79
-
80
-
81
-
82
-
83
-
84
-
85
-
86
-
87
-
88
-
89
-
90
-
91
-
92
-
93
-
94
-
95
-
96
-
97
-
98
-
99
-
100
-
101
-
102
-
103
-
104
-
105
-
106
-
107
-
108
-
109
-
110
-
111
-
112
-
113
-
114
-
115
-
116
-
117
-
118
-
119
-
120
-
121
-
122
-
123
-
124
-
125
-
126
-
127
-
128
-
129
-
130
-
131
-
132
-
133
-
134
-
135
-
136
-
137
-
138
-
139
-
140
-
141
-
142
-
143
-
144
-
145
-
146
-
147
-
148
-
149
-
150
-
151
-
152
-
153
-
154
-
155
-
156
-
157
-
158
-
159
-
160
-
161
-
162
-
163
-
164
-
165
-
166
-
167
-
168
-
169
-
170
-
171
-
172
-
173
-
174
-
175
-
176
-
177
-
178
-
179
-
180
-
181
-
182
-
183
-
184
-
185
-
186
-
187
-
188
-
189
-
190
-
191
-
192
-
193
-
194
-
195
-
196
-
197
-
198
-
199
-
200
-
201
-
202
-
203
-
204
-
205
-
206
-
207
-
208
-
209
-
210
-
211
-
212
-
213
-
214
-
215
-
216
-
217
-
218
-
219
-
220
-
221
-
222
-
223
-
224
-
225
-
226
-
227
-
228
-
229
-
230
-
231
-
232
-
233
-
234
-
235
-
236
-
237
-
238
-
239
-
240
-
241
-
242
-
243
-
244
-
245
-
246
-
247
-
248
-
249
-
250
-
251
-
252
-
253
-
254
-
255
-
256
-
257
-
258
-
259
-
260
-
261
-
262
-
263
-
264
-
265
-
266
-
267
-
268
-
269
-
270
-
271
-
272
 |
 |

Bank of America 2014 39
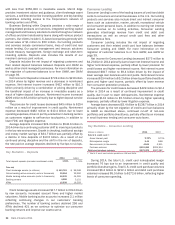
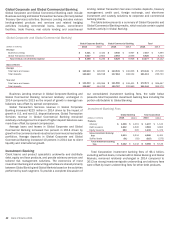
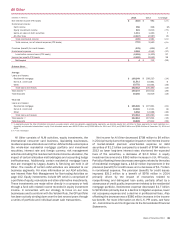
Global Wealth & Investment Management
(Dollars in millions) 2014 2013 % Change
Net interest income (FTE basis) $ 5,836 $ 6,064 (4)%
Noninterest income:
Investment and brokerage services 10,722 9,709 10
All other income 1,846 2,017 (8)
Total noninterest income 12,568 11,726 7
Total revenue, net of interest expense (FTE basis) 18,404 17,790 3
Provision for credit losses 14 56 (75)
Noninterest expense 13,647 13,033 5
Income before income taxes (FTE basis) 4,743 4,701 1
Income tax expense (FTE basis) 1,769 1,724 3
Net income $ 2,974 $ 2,977 —
Net interest yield (FTE basis) 2.33%2.41%
Return on average allocated capital 25 30
Efficiency ratio (FTE basis) 74.15 73.26
Balance Sheet
Average
Total loans and leases $ 119,775 $ 111,023 8
Total earning assets 250,747 251,395 —
Total assets 269,279 270,789 (1)
Total deposits 240,242 242,161 (1)
Allocated capital 12,000 10,000 20
Year end
Total loans and leases $ 125,431 $ 115,846 8
Total earning assets 258,219 254,031 2
Total assets 276,587 274,113 1
Total deposits 245,391 244,901 —
GWIM consists of two primary businesses: Merrill Lynch Global
Wealth Management (MLGWM) and U.S. Trust, Bank of America
Private Wealth Management (U.S. Trust).
MLGWM’s advisory business provides a high-touch client
experience through a network of financial advisors focused on
clients with over $250,000 in total investable assets. MLGWM
provides tailored solutions to meet our clients’ needs through a
full set of brokerage, banking and retirement products.
U.S. Trust, together with MLGWM’s Private Banking &
Investments Group, provides comprehensive wealth management
solutions targeted to high net worth and ultra high net worth clients,
as well as customized solutions to meet clients’ wealth structuring,
investment management, trust and banking needs, including
specialty asset management services.
Net income remained relatively unchanged in 2014 compared
to 2013 as an increase in noninterest income and lower credit
costs were offset by lower net interest income and higher
noninterest expense.
Net interest income decreased $228 million to $5.8 billion as
a result of the low rate environment, partially offset by the impact
of loan growth. Noninterest income, primarily investment and
brokerage services, increased $842 million to $12.6 billion driven
by increased asset management fees due to the impact of long-
term AUM flows and higher market levels, partially offset by lower
transactional revenue. Noninterest expense increased $614
million to $13.6 billion primarily due to higher revenue-related
incentive compensation and support expenses, partially offset by
lower other expenses.
Return on average allocated capital was 25 percent, down from
30 percent due to an increase in capital allocations. For more
information on capital allocated to the business segments, see
Business Segment Operations on page 31.
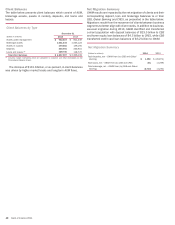
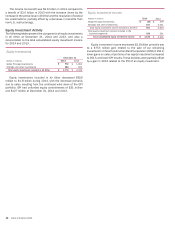
Revenue by Business
The table below summarizes revenue for MLGWM, U.S. Trust and
other GWIM businesses.
Revenue by Business
(Dollars in millions) 2014 2013
Merrill Lynch Global Wealth Management $ 15,256 $ 14,771
U.S. Trust 3,084 2,953
Other (1) 64 66
Total revenue, net of interest expense (FTE basis) $ 18,404 $ 17,790
(1) Other includes the results of BofA Global Capital Management and other administrative items.
In 2014, revenue from MLGWM was $15.3 billion, up three
percent, driven by increased asset management fees due to the
impact of long-term AUM flows and higher market levels, partially
offset by the impact of the low rate environment on net interest
income and lower transactional revenue. In 2014, revenue from
U.S. Trust was $3.1 billion, up four percent, driven by increased
asset management fees due to the impact of higher market levels
and long-term AUM flows.