Bank of America 2014 Annual Report Download - page 65
Download and view the complete annual report
Please find page 65 of the 2014 Bank of America annual report below. You can navigate through the pages in the report by either clicking on the pages listed below, or by using the keyword search tool below to find specific information within the annual report.-
 1
1 -
2
-
3
-
4
-
5
-
6
-
7
-
8
-
9
-
10
-
11
-
12
-
13
-
14
-
15
-
16
-
17
-
18
-
19
-
20
-
21
-
22
-
23
-
24
-
25
-
26
-
27
-
28
-
29
-
30
-
31
-
32
-
33
-
34
-
35
-
36
-
37
-
38
-
39
-
40
-
41
-
42
-
43
-
44
-
45
-
46
-
47
-
48
-
49
-
50
-
51
-
52
-
53
-
54
-
 55
55 -
 56
56 -
 57
57 -
 58
58 -
 59
59 -
 60
60 -
 61
61 -
 62
62 -
 63
63 -
 64
64 -
 65
65 -
 66
66 -
 67
67 -
 68
68 -
 69
69 -
 70
70 -
 71
71 -
 72
72 -
 73
73 -
 74
74 -
 75
75 -
76
-
77
-
78
-
79
-
80
-
81
-
82
-
83
-
84
-
85
-
86
-
87
-
88
-
89
-
90
-
91
-
92
-
93
-
94
-
95
-
96
-
97
-
98
-
99
-
100
-
101
-
102
-
103
-
104
-
105
-
106
-
107
-
108
-
109
-
110
-
111
-
112
-
113
-
114
-
115
-
116
-
117
-
118
-
119
-
120
-
121
-
122
-
123
-
124
-
125
-
126
-
127
-
128
-
129
-
130
-
131
-
132
-
133
-
134
-
135
-
136
-
137
-
138
-
139
-
140
-
141
-
142
-
143
-
144
-
145
-
146
-
147
-
148
-
149
-
150
-
151
-
152
-
153
-
154
-
155
-
156
-
157
-
158
-
159
-
160
-
161
-
162
-
163
-
164
-
165
-
166
-
167
-
168
-
169
-
170
-
171
-
172
-
173
-
174
-
175
-
176
-
177
-
178
-
179
-
180
-
181
-
182
-
183
-
184
-
185
-
186
-
187
-
188
-
189
-
190
-
191
-
192
-
193
-
194
-
195
-
196
-
197
-
198
-
199
-
200
-
201
-
202
-
203
-
204
-
205
-
206
-
207
-
208
-
209
-
210
-
211
-
212
-
213
-
214
-
215
-
216
-
217
-
218
-
219
-
220
-
221
-
222
-
223
-
224
-
225
-
226
-
227
-
228
-
229
-
230
-
231
-
232
-
233
-
234
-
235
-
236
-
237
-
238
-
239
-
240
-
241
-
242
-
243
-
244
-
245
-
246
-
247
-
248
-
249
-
250
-
251
-
252
-
253
-
254
-
255
-
256
-
257
-
258
-
259
-
260
-
261
-
262
-
263
-
264
-
265
-
266
-
267
-
268
-
269
-
270
-
271
-
272
 |
 |

Bank of America 2014 63
group of non-U.S. government and supranational securities. We
believe we can quickly obtain cash for these securities, even in
stressed market conditions, through repurchase agreements or
outright sales. We hold our Global Excess Liquidity Sources in legal
entities that allow us to meet the liquidity requirements of our
global businesses, and we consider the impact of potential
regulatory, tax, legal and other restrictions that could limit the
transferability of funds among entities. Our Global Excess Liquidity
Sources are substantially the same in composition to what
qualifies as High Quality Liquid Assets (HQLA) under the final LCR
rules. For more information on the final rules, see Liquidity Risk –
Basel 3 Liquidity Standards on page 64.
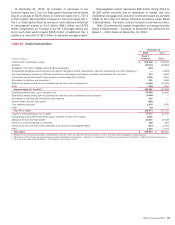
Our Global Excess Liquidity Sources were $439 billion and
$376 billion at December 31, 2014 and 2013, and were
maintained as presented in Table 18.
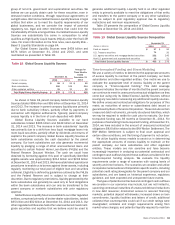
Table 18 Global Excess Liquidity Sources
December 31
Average for
Three Months
Ended
December 31
2014
(Dollars in billions) 2014 2013
Parent company $98
$95
$92
Bank subsidiaries 306 249 314
Other regulated entities 35 32 32
Total Global Excess Liquidity Sources $ 439 $ 376 $ 438
As shown in Table 18, parent company Global Excess Liquidity
Sources totaled $98 billion and $95 billion at December 31, 2014
and 2013. The increase in parent company liquidity was primarily
due to bank subsidiary inflows, partially offset by payments in
connection with litigation settlements. Typically, parent company
excess liquidity is in the form of cash deposited with BANA.
Global Excess Liquidity Sources available to our bank
subsidiaries totaled $306 billion and $249 billion at December
31, 2014 and 2013. The increase in bank subsidiaries’ liquidity
was primarily due to a shift from less liquid mortgage loans into
more liquid securities, partially offset by dividends and returns of
capital to the parent company. Global Excess Liquidity Sources at
bank subsidiaries exclude the cash deposited by the parent
company. Our bank subsidiaries can also generate incremental
liquidity by pledging a range of other unencumbered loans and
securities to certain Federal Home Loan Banks (FHLBs) and the
Federal Reserve Discount Window. The cash we could have
obtained by borrowing against this pool of specifically-identified
eligible assets was approximately $214 billion and $218 billion
at December 31, 2014 and 2013. We have established operational
procedures to enable us to borrow against these assets, including
regularly monitoring our total pool of eligible loan and securities
collateral. Eligibility is defined by guidelines outlined by the FHLBs
and the Federal Reserve and is subject to change at their
discretion. Due to regulatory restrictions, liquidity generated by the
bank subsidiaries can generally be used only to fund obligations
within the bank subsidiaries and can only be transferred to the
parent company or nonbank subsidiaries with prior regulatory
approval.
Global Excess Liquidity Sources available to our other regulated
entities, comprised primarily of broker-dealer subsidiaries, totaled
$35 billion and $32 billion at December 31, 2014 and 2013. Our
other regulated entities also held other unencumbered investment-
grade securities and equities that we believe could be used to
generate additional liquidity. Liquidity held in an other regulated
entity is primarily available to meet the obligations of that entity
and transfers to the parent company or to any other subsidiary
may be subject to prior regulatory approval due to regulatory
restrictions and minimum requirements.
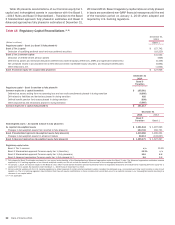
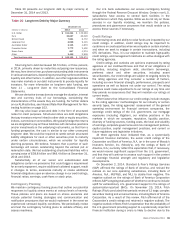
Table 19 presents the composition of Global Excess Liquidity
Sources at December 31, 2014 and 2013.
Table 19 Global Excess Liquidity Sources Composition
December 31
(Dollars in billions) 2014 2013
Cash on deposit $97
$90
U.S. Treasury securities 74 20
U.S. agency securities and mortgage-backed securities 252 245
Non-U.S. government and supranational securities 16 21
Total Global Excess Liquidity Sources $ 439 $ 376
Time-to-required Funding and Stress Modeling
We use a variety of metrics to determine the appropriate amounts
of excess liquidity to maintain at the parent company, our bank
subsidiaries and other regulated entities. One metric we use to
evaluate the appropriate level of excess liquidity at the parent
company is “time-to-required funding.” This debt coverage
measure indicates the number of months that the parent company
can continue to meet its unsecured contractual obligations as they
come due using only its Global Excess Liquidity Sources without
issuing any new debt or accessing any additional liquidity sources.
We define unsecured contractual obligations for purposes of this
metric as maturities of senior or subordinated debt issued or
guaranteed by Bank of America Corporation. These include certain
unsecured debt instruments, primarily structured liabilities, which
we may be required to settle for cash prior to maturity. Our time-
to-required funding was 39 months at December 31, 2014. For
purposes of calculating time-to-required funding, at December 31,
2014, we have included in the amount of unsecured contractual
obligations $8.6 billion related to the BNY Mellon Settlement. The
BNY Mellon Settlement is subject to final court approval and
certain other conditions, and the timing of payment is not certain.
We utilize liquidity stress models to assist us in determining
the appropriate amounts of excess liquidity to maintain at the
parent company, our bank subsidiaries and other regulated
entities. These models are risk sensitive and have become
increasingly important in analyzing our potential contractual and
contingent cash outflows beyond those outflows considered in the
time-to-required funding analysis. We evaluate the liquidity
requirements under a range of scenarios with varying levels of
severity and time horizons. The scenarios we consider and utilize
incorporate market-wide and Corporation-specific events, including
potential credit rating downgrades for the parent company and our
subsidiaries, and are based on historical experience, regulatory
guidance, and both expected and unexpected future events.
The types of potential contractual and contingent cash outflows
we consider in our scenarios may include, but are not limited to,
upcoming contractual maturities of unsecured debt and reductions
in new debt issuance; diminished access to secured financing
markets; potential deposit withdrawals; increased draws on loan
commitments, liquidity facilities and letters of credit; additional
collateral that counterparties could call if our credit ratings were
downgraded; collateral and margin requirements arising from
market value changes; and potential liquidity required to maintain