Bank of America 2014 Annual Report Download - page 90
Download and view the complete annual report
Please find page 90 of the 2014 Bank of America annual report below. You can navigate through the pages in the report by either clicking on the pages listed below, or by using the keyword search tool below to find specific information within the annual report.-
 1
1 -
2
-
3
-
4
-
5
-
6
-
7
-
8
-
9
-
10
-
11
-
12
-
13
-
14
-
15
-
16
-
17
-
18
-
19
-
20
-
21
-
22
-
23
-
24
-
25
-
26
-
27
-
28
-
29
-
30
-
31
-
32
-
33
-
34
-
35
-
36
-
37
-
38
-
39
-
40
-
41
-
42
-
43
-
44
-
45
-
46
-
47
-
48
-
49
-
50
-
51
-
52
-
53
-
54
-
55
-
56
-
57
-
58
-
59
-
60
-
61
-
62
-
63
-
64
-
65
-
66
-
67
-
68
-
69
-
70
-
71
-
72
-
73
-
74
-
75
-
76
-
77
-
78
-
79
-
 80
80 -
 81
81 -
 82
82 -
 83
83 -
 84
84 -
 85
85 -
 86
86 -
 87
87 -
 88
88 -
 89
89 -
 90
90 -
 91
91 -
 92
92 -
 93
93 -
 94
94 -
 95
95 -
 96
96 -
 97
97 -
 98
98 -
 99
99 -
 100
100 -
101
-
102
-
103
-
104
-
105
-
106
-
107
-
108
-
109
-
110
-
111
-
112
-
113
-
114
-
115
-
116
-
117
-
118
-
119
-
120
-
121
-
122
-
123
-
124
-
125
-
126
-
127
-
128
-
129
-
130
-
131
-
132
-
133
-
134
-
135
-
136
-
137
-
138
-
139
-
140
-
141
-
142
-
143
-
144
-
145
-
146
-
147
-
148
-
149
-
150
-
151
-
152
-
153
-
154
-
155
-
156
-
157
-
158
-
159
-
160
-
161
-
162
-
163
-
164
-
165
-
166
-
167
-
168
-
169
-
170
-
171
-
172
-
173
-
174
-
175
-
176
-
177
-
178
-
179
-
180
-
181
-
182
-
183
-
184
-
185
-
186
-
187
-
188
-
189
-
190
-
191
-
192
-
193
-
194
-
195
-
196
-
197
-
198
-
199
-
200
-
201
-
202
-
203
-
204
-
205
-
206
-
207
-
208
-
209
-
210
-
211
-
212
-
213
-
214
-
215
-
216
-
217
-
218
-
219
-
220
-
221
-
222
-
223
-
224
-
225
-
226
-
227
-
228
-
229
-
230
-
231
-
232
-
233
-
234
-
235
-
236
-
237
-
238
-
239
-
240
-
241
-
242
-
243
-
244
-
245
-
246
-
247
-
248
-
249
-
250
-
251
-
252
-
253
-
254
-
255
-
256
-
257
-
258
-
259
-
260
-
261
-
262
-
263
-
264
-
265
-
266
-
267
-
268
-
269
-
270
-
271
-
272
 |
 |

88 Bank of America 2014
market liquidity, and lower levels of originations. Real estate
construction and land development exposure represented 13
percent and 14 percent of the total real estate industry committed
exposure at December 31, 2014 and 2013. For more information
on commercial real estate and related portfolios, see Commercial
Portfolio Credit Risk Management – Commercial Real Estate on
page 84.
The following changes in our industry concentration occurred
during 2014. Committed exposure to the energy industry
increased $6.5 billion, or 16 percent, driven by higher exposure
in the oil and gas refining and marketing, exploration and
production, and equipment and services sectors. The latter two
sectors include bridge financing, a significant portion of which was
subsequently distributed. Food, beverage and tobacco committed
exposure increased $3.9 billion, or 13 percent, primarily reflecting
bridge financing in the beverage sector. Retailing industry
committed exposure increased $3.4 billion, or six percent, driven
by higher exposure to internet retail and wholesale food and
beverage sectors. The healthcare equipment and services industry
increased $3.4 billion, or seven percent, primarily driven by bridge
financing for acquisitions. Telecommunications services
committed exposure decreased $2.1 billion, or 19 percent,
primarily reflecting broadly distributed commitment reductions and
paydowns.
The significant decline in oil prices since June 2014 has
impacted and may continue to impact the financial performance
of energy producers as well as energy equipment and service
providers. While we did not experience material asset quality
deterioration in our energy portfolio through December 31, 2014,
the magnitude of the impact over time will depend upon the level
and duration of future oil prices.
Our committed state and municipal exposure of $38.5 billion
at December 31, 2014 consisted of $31.7 billion of commercial
utilized exposure (including $19.1 billion of funded loans, $6.3
billion of SBLCs and $2.4 billion of derivative assets) and $6.8
billion of unfunded commercial exposure (primarily unfunded loan
commitments and letters of credit) and is reported in the
government and public education industry in Table 50. With the
U.S. economy gradually strengthening, most state and local
governments are experiencing improved fiscal conditions and
continue to honor debt obligations as agreed. While historical
default rates have been low, as part of our overall and ongoing
risk management processes, we continually monitor these
exposures through a rigorous review process. Additionally, internal
communications are regularly circulated such that exposure levels
are maintained in compliance with established concentration
guidelines.
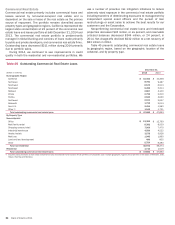
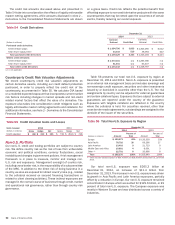
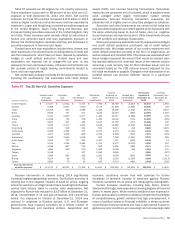
Table 50 Commercial Credit Exposure by Industry (1)
December 31
Commercial
Utilized
Total Commercial
Committed
(Dollars in millions) 2014 2013 2014 2013
Diversified financials $ 63,306 $ 76,673 $ 103,528 $ 118,092
Real estate (2) 53,834 54,336 76,153 76,418
Retailing 33,683 32,859 58,043 54,616
Capital goods 29,028 28,016 54,653 52,849
Healthcare equipment and services 32,923 30,828 52,450 49,063
Government and public education 42,095 40,253 49,937 48,322
Banking 42,330 41,399 48,353 48,078
Energy 23,830 19,739 47,667 41,156
Materials 23,664 22,384 45,821 42,699
Food, beverage and tobacco 16,131 14,437 34,465 30,541
Consumer services 21,657 21,080 33,269 34,217
Commercial services and supplies 17,997 19,770 30,451 32,007
Utilities 9,399 9,253 25,235 25,243
Transportation 17,538 15,280 24,541 22,595
Media 11,128 13,070 21,502 22,655
Individuals and trusts 16,749 14,864 21,195 18,681
Software and services 5,927 6,814 14,071 14,172
Pharmaceuticals and biotechnology 5,707 6,455 13,493 13,986
Technology hardware and equipment 5,489 6,166 12,350 12,733
Insurance, including monolines 5,204 5,926 11,252 12,203
Consumer durables and apparel 6,111 5,427 10,613 9,757
Automobiles and components 4,114 3,165 9,683 8,424
Telecommunication services 3,814 4,541 9,295 11,423
Food and staples retailing 3,848 3,950 7,418 7,909
Religious and social organizations 4,881 5,452 6,548 7,677
Other 6,255 5,357 10,415 8,309
Total commercial credit exposure by industry $ 506,642 $507,494 $ 832,401 $ 823,825
Net credit default protection purchased on total commitments (3) $(7,302)$ (8,085)
(1) Includes U.S. small business commercial exposure.
(2) Industries are viewed from a variety of perspectives to best isolate the perceived risks. For purposes of this table, the real estate industry is defined based on the borrowers’ or counterparties’
primary business activity using operating cash flows and primary source of repayment as key factors.
(3) Represents net notional credit protection purchased. For additional information, see Commercial Portfolio Credit Risk Management – Risk Mitigation on page 89.