Bank of America 2014 Annual Report Download - page 47
Download and view the complete annual report
Please find page 47 of the 2014 Bank of America annual report below. You can navigate through the pages in the report by either clicking on the pages listed below, or by using the keyword search tool below to find specific information within the annual report.-
 1
1 -
2
-
3
-
4
-
5
-
6
-
7
-
8
-
9
-
10
-
11
-
12
-
13
-
14
-
15
-
16
-
17
-
18
-
19
-
20
-
21
-
22
-
23
-
24
-
25
-
26
-
27
-
28
-
29
-
30
-
31
-
32
-
33
-
34
-
35
-
36
-
 37
37 -
 38
38 -
 39
39 -
 40
40 -
 41
41 -
 42
42 -
 43
43 -
 44
44 -
 45
45 -
 46
46 -
 47
47 -
 48
48 -
 49
49 -
 50
50 -
 51
51 -
 52
52 -
 53
53 -
 54
54 -
 55
55 -
 56
56 -
 57
57 -
58
-
59
-
60
-
61
-
62
-
63
-
64
-
65
-
66
-
67
-
68
-
69
-
70
-
71
-
72
-
73
-
74
-
75
-
76
-
77
-
78
-
79
-
80
-
81
-
82
-
83
-
84
-
85
-
86
-
87
-
88
-
89
-
90
-
91
-
92
-
93
-
94
-
95
-
96
-
97
-
98
-
99
-
100
-
101
-
102
-
103
-
104
-
105
-
106
-
107
-
108
-
109
-
110
-
111
-
112
-
113
-
114
-
115
-
116
-
117
-
118
-
119
-
120
-
121
-
122
-
123
-
124
-
125
-
126
-
127
-
128
-
129
-
130
-
131
-
132
-
133
-
134
-
135
-
136
-
137
-
138
-
139
-
140
-
141
-
142
-
143
-
144
-
145
-
146
-
147
-
148
-
149
-
150
-
151
-
152
-
153
-
154
-
155
-
156
-
157
-
158
-
159
-
160
-
161
-
162
-
163
-
164
-
165
-
166
-
167
-
168
-
169
-
170
-
171
-
172
-
173
-
174
-
175
-
176
-
177
-
178
-
179
-
180
-
181
-
182
-
183
-
184
-
185
-
186
-
187
-
188
-
189
-
190
-
191
-
192
-
193
-
194
-
195
-
196
-
197
-
198
-
199
-
200
-
201
-
202
-
203
-
204
-
205
-
206
-
207
-
208
-
209
-
210
-
211
-
212
-
213
-
214
-
215
-
216
-
217
-
218
-
219
-
220
-
221
-
222
-
223
-
224
-
225
-
226
-
227
-
228
-
229
-
230
-
231
-
232
-
233
-
234
-
235
-
236
-
237
-
238
-
239
-
240
-
241
-
242
-
243
-
244
-
245
-
246
-
247
-
248
-
249
-
250
-
251
-
252
-
253
-
254
-
255
-
256
-
257
-
258
-
259
-
260
-
261
-
262
-
263
-
264
-
265
-
266
-
267
-
268
-
269
-
270
-
271
-
272
 |
 |

Bank of America 2014 45
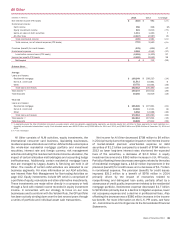
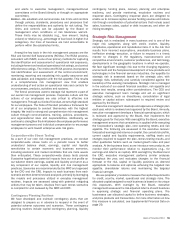
All Other
(Dollars in millions) 2014 2013 % Change
Net interest income (FTE basis) $ (516) $ 982 n/m
Noninterest income:
Card income 356 328 9%
Equity investment income 601 2,610 (77)
Gains on sales of debt securities 1,311 1,230 7
All other loss (2,467)(2,587) (5)
Total noninterest income (199) 1,581 n/m
Total revenue, net of interest expense (FTE basis) (715) 2,563 n/m
Provision (benefit) for credit losses (978) (666) 47
Noninterest expense 2,881 4,559 (37)
Loss before income taxes (FTE basis) (2,618)(1,330) 97
Income tax benefit (FTE basis) (2,622)(2,042) 28
Net income $4
$ 712 (99)
Balance Sheet
Average
Loans and leases:
Residential mortgage $ 180,249 $208,535 (14)
Non-U.S. credit card 11,511 10,861 6
Other 10,752 16,064 (33)
Total loans and leases 202,512 235,460 (14)
Total assets (1) 160,272 216,012 (26)
Total deposits 30,255 34,919 (13)
Year end
Loans and leases:
Residential mortgage $ 155,595 $197,061 (21)
Non-U.S. credit card 10,465 11,541 (9)
Other 6,552 12,088 (46)
Total loans and leases 172,612 220,690 (22)
Total assets (1) 142,812 167,624 (15)
Total deposits 18,898 27,912 (32)
(1) In segments where the total of liabilities and equity exceeds assets, which are generally deposit-taking segments, we allocate assets from All Other to those segments to match liabilities (i.e.,
deposits) and allocated shareholders’ equity. Such allocated assets were $595.2 billion and $538.8 billion for 2014 and 2013, and $589.9 billion and $569.8 billion at December 31, 2014 and
2013.
n/m = not meaningful
All Other consists of ALM activities, equity investments, the
international consumer card business, liquidating businesses,
residual expense allocations and other. ALM activities encompass
the whole-loan residential mortgage portfolio and investment
securities, interest rate and foreign currency risk management
activities including the residual net interest income allocation, the
impact of certain allocation methodologies and accounting hedge
ineffectiveness. Additionally, certain residential mortgage loans
that are managed by Legacy Assets & Servicing are held in All
Other. The results of certain ALM activities are allocated to our
business segments. For more information on our ALM activities,
see Interest Rate Risk Management for Non-trading Activities on
page 102. Equity investments include GPI which is comprised of
a portfolio of equity, real estate and other alternative investments.
These investments are made either directly in a company or held
through a fund with related income recorded in equity investment
income. In connection with our strategy to focus on our core
businesses and to conform with the Volcker Rule, the GPI portfolio
has been actively winding down over the last several years through
a series of portfolio and individual asset sale transactions.
Net income for All Other decreased $708 million to $4 million
in 2014 primarily due to the negative impact on net interest income
of market-related premium amortization expense on debt
securities of $1.2 billion compared to a benefit of $784 million in
2013 as lower long-term interest rates shortened the expected
lives of the securities, a decrease of $2.0 billion in equity
investment income and a $363 million increase in U.K. PPI costs.
Partially offsetting these decreases were gains related to the sales
of residential mortgage loans, a $312 million improvement in the
provision (benefit) for credit losses and a decrease of $1.7 billion
in noninterest expense. The provision (benefit) for credit losses
improved $312 million to a benefit of $978 million in 2014
primarily driven by the impact of recoveries related to
nonperforming and delinquent loan sales, partially offset by a
slower pace of credit quality improvement related to the residential
mortgage portfolio. Noninterest expense decreased $1.7 billion
to $2.9 billion primarily due to a decline in litigation expense, lower
net occupancy expense and a decline in professional fees. Also
offsetting the decrease was a $580 million increase in the income
tax benefit. For more information on the U.K. PPI costs, see Note
12 – Commitments and Contingencies to the Consolidated Financial
Statements.