Bank of America 2014 Annual Report Download - page 43
Download and view the complete annual report
Please find page 43 of the 2014 Bank of America annual report below. You can navigate through the pages in the report by either clicking on the pages listed below, or by using the keyword search tool below to find specific information within the annual report.-
 1
1 -
2
-
3
-
4
-
5
-
6
-
7
-
8
-
9
-
10
-
11
-
12
-
13
-
14
-
15
-
16
-
17
-
18
-
19
-
20
-
21
-
22
-
23
-
24
-
25
-
26
-
27
-
28
-
29
-
30
-
31
-
32
-
 33
33 -
 34
34 -
 35
35 -
 36
36 -
 37
37 -
 38
38 -
 39
39 -
 40
40 -
 41
41 -
 42
42 -
 43
43 -
 44
44 -
 45
45 -
 46
46 -
 47
47 -
 48
48 -
 49
49 -
 50
50 -
 51
51 -
 52
52 -
 53
53 -
54
-
55
-
56
-
57
-
58
-
59
-
60
-
61
-
62
-
63
-
64
-
65
-
66
-
67
-
68
-
69
-
70
-
71
-
72
-
73
-
74
-
75
-
76
-
77
-
78
-
79
-
80
-
81
-
82
-
83
-
84
-
85
-
86
-
87
-
88
-
89
-
90
-
91
-
92
-
93
-
94
-
95
-
96
-
97
-
98
-
99
-
100
-
101
-
102
-
103
-
104
-
105
-
106
-
107
-
108
-
109
-
110
-
111
-
112
-
113
-
114
-
115
-
116
-
117
-
118
-
119
-
120
-
121
-
122
-
123
-
124
-
125
-
126
-
127
-
128
-
129
-
130
-
131
-
132
-
133
-
134
-
135
-
136
-
137
-
138
-
139
-
140
-
141
-
142
-
143
-
144
-
145
-
146
-
147
-
148
-
149
-
150
-
151
-
152
-
153
-
154
-
155
-
156
-
157
-
158
-
159
-
160
-
161
-
162
-
163
-
164
-
165
-
166
-
167
-
168
-
169
-
170
-
171
-
172
-
173
-
174
-
175
-
176
-
177
-
178
-
179
-
180
-
181
-
182
-
183
-
184
-
185
-
186
-
187
-
188
-
189
-
190
-
191
-
192
-
193
-
194
-
195
-
196
-
197
-
198
-
199
-
200
-
201
-
202
-
203
-
204
-
205
-
206
-
207
-
208
-
209
-
210
-
211
-
212
-
213
-
214
-
215
-
216
-
217
-
218
-
219
-
220
-
221
-
222
-
223
-
224
-
225
-
226
-
227
-
228
-
229
-
230
-
231
-
232
-
233
-
234
-
235
-
236
-
237
-
238
-
239
-
240
-
241
-
242
-
243
-
244
-
245
-
246
-
247
-
248
-
249
-
250
-
251
-
252
-
253
-
254
-
255
-
256
-
257
-
258
-
259
-
260
-
261
-
262
-
263
-
264
-
265
-
266
-
267
-
268
-
269
-
270
-
271
-
272
 |
 |

Bank of America 2014 41
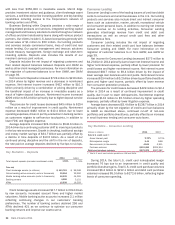
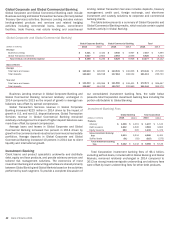
Global Banking
(Dollars in millions) 2014 2013 % Change
Net interest income (FTE basis) $ 8,999 $ 8,914 1%
Noninterest income:
Service charges 2,717 2,787 (3)
Investment banking fees 3,213 3,234 (1)
All other income 1,669 1,544 8
Total noninterest income 7,599 7,565 —
Total revenue, net of interest expense (FTE basis) 16,598 16,479 1
Provision for credit losses 336 1,075 (69)
Noninterest expense 7,681 7,551 2
Income before income taxes (FTE basis) 8,581 7,853 9
Income tax expense (FTE basis) 3,146 2,880 9
Net income $ 5,435 $ 4,973 9
Net interest yield (FTE basis) 2.57%2.97%
Return on average allocated capital 18 22
Efficiency ratio (FTE basis) 46.28 45.82
Balance Sheet
Average
Total loans and leases $ 270,164 $ 257,249 5
Total earning assets 350,668 300,511 17
Total assets 393,721 342,772 15
Total deposits 261,312 236,765 10
Allocated capital 31,000 23,000 35
Year end
Total loans and leases $ 272,572 $ 269,469 1
Total earning assets 336,776 336,606 —
Total assets 379,513 378,659 —
Total deposits 251,344 265,171 (5)
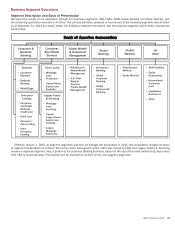
Global Banking, which includes Global Corporate and Global
Commercial Banking, and Investment Banking, provides a wide
range of lending-related products and services, integrated working
capital management and treasury solutions to clients, and
underwriting and advisory services through our network of offices
and client relationship teams. Our lending products and services
include commercial loans, leases, commitment facilities, trade
finance, real estate lending and asset-based lending. Our treasury
solutions business includes treasury management, foreign
exchange and short-term investing options. We also provide
investment banking products to our clients such as debt and equity
underwriting and distribution, and merger-related and other
advisory services. Underwriting debt and equity issuances, fixed-
income and equity research, and certain market-based activities
are executed through our global broker-dealer affiliates which are
our primary dealers in several countries. Within Global Banking,
Global Commercial Banking clients generally include middle-
market companies, commercial real estate firms, auto dealerships
and not-for-profit companies. Global Corporate Banking includes
large global corporations, financial institutions and leasing clients.
Net income for Global Banking increased $462 million to $5.4
billion in 2014 compared to 2013 primarily driven by a reduction
in the provision for credit losses and, to a lesser degree, an
increase in revenue, partially offset by higher noninterest expense.
Revenue increased $119 million to $16.6 billion in 2014 primarily
from higher net interest income.
The provision for credit losses decreased $739 million to $336
million in 2014 driven by improved credit quality in the current year,
and the prior year included increased reserves from loan growth.
Noninterest expense increased $130 million to $7.7 billion in
2014 primarily from additional client-facing personnel expense
and higher litigation expense.
Return on average allocated capital was 18 percent in 2014,
down from 22 percent in 2013 as growth in earnings was more
than offset by increased capital allocations. For more information
on capital allocated to the business segments, see Business
Segment Operations on page 31.