Bank of America 2014 Annual Report Download - page 95
Download and view the complete annual report
Please find page 95 of the 2014 Bank of America annual report below. You can navigate through the pages in the report by either clicking on the pages listed below, or by using the keyword search tool below to find specific information within the annual report.-
 1
1 -
2
-
3
-
4
-
5
-
6
-
7
-
8
-
9
-
10
-
11
-
12
-
13
-
14
-
15
-
16
-
17
-
18
-
19
-
20
-
21
-
22
-
23
-
24
-
25
-
26
-
27
-
28
-
29
-
30
-
31
-
32
-
33
-
34
-
35
-
36
-
37
-
38
-
39
-
40
-
41
-
42
-
43
-
44
-
45
-
46
-
47
-
48
-
49
-
50
-
51
-
52
-
53
-
54
-
55
-
56
-
57
-
58
-
59
-
60
-
61
-
62
-
63
-
64
-
65
-
66
-
67
-
68
-
69
-
70
-
71
-
72
-
73
-
74
-
75
-
76
-
77
-
78
-
79
-
80
-
81
-
82
-
83
-
84
-
 85
85 -
 86
86 -
 87
87 -
 88
88 -
 89
89 -
 90
90 -
 91
91 -
 92
92 -
 93
93 -
 94
94 -
 95
95 -
 96
96 -
 97
97 -
 98
98 -
 99
99 -
 100
100 -
 101
101 -
 102
102 -
 103
103 -
 104
104 -
 105
105 -
106
-
107
-
108
-
109
-
110
-
111
-
112
-
113
-
114
-
115
-
116
-
117
-
118
-
119
-
120
-
121
-
122
-
123
-
124
-
125
-
126
-
127
-
128
-
129
-
130
-
131
-
132
-
133
-
134
-
135
-
136
-
137
-
138
-
139
-
140
-
141
-
142
-
143
-
144
-
145
-
146
-
147
-
148
-
149
-
150
-
151
-
152
-
153
-
154
-
155
-
156
-
157
-
158
-
159
-
160
-
161
-
162
-
163
-
164
-
165
-
166
-
167
-
168
-
169
-
170
-
171
-
172
-
173
-
174
-
175
-
176
-
177
-
178
-
179
-
180
-
181
-
182
-
183
-
184
-
185
-
186
-
187
-
188
-
189
-
190
-
191
-
192
-
193
-
194
-
195
-
196
-
197
-
198
-
199
-
200
-
201
-
202
-
203
-
204
-
205
-
206
-
207
-
208
-
209
-
210
-
211
-
212
-
213
-
214
-
215
-
216
-
217
-
218
-
219
-
220
-
221
-
222
-
223
-
224
-
225
-
226
-
227
-
228
-
229
-
230
-
231
-
232
-
233
-
234
-
235
-
236
-
237
-
238
-
239
-
240
-
241
-
242
-
243
-
244
-
245
-
246
-
247
-
248
-
249
-
250
-
251
-
252
-
253
-
254
-
255
-
256
-
257
-
258
-
259
-
260
-
261
-
262
-
263
-
264
-
265
-
266
-
267
-
268
-
269
-
270
-
271
-
272
 |
 |
Bank of America 2014 93
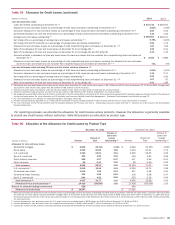
The second component of the allowance for loan and lease
losses covers the remaining consumer and commercial loans and
leases that have incurred losses that are not yet individually
identifiable. The allowance for consumer and certain
homogeneous commercial loan and lease products is based on
aggregated portfolio evaluations, generally by product type. Loss
forecast models are utilized that consider a variety of factors
including, but not limited to, historical loss experience, estimated
defaults or foreclosures based on portfolio trends, delinquencies,
economic trends and credit scores. Our consumer real estate loss
forecast model estimates the portion of loans that will default
based on individual loan attributes, the most significant of which
are refreshed LTV or CLTV, and borrower credit score as well as
vintage and geography, all of which are further broken down into
current delinquency status. Additionally, we incorporate the
delinquency status of underlying first-lien loans on our junior-lien
home equity portfolio in our allowance process. Incorporating
refreshed LTV and CLTV into our probability of default allows us to
factor the impact of changes in home prices into our allowance
for loan and lease losses. These loss forecast models are updated
on a quarterly basis to incorporate information reflecting the
current economic environment. As of December 31, 2014, the loss
forecast process resulted in reductions in the allowance for all
major consumer portfolios compared to December 31, 2013.
The allowance for commercial loan and lease losses is
established by product type after analyzing historical loss
experience, internal risk rating, current economic conditions,
industry performance trends, geographic and obligor
concentrations within each portfolio and any other pertinent
information. The statistical models for commercial loans are
generally updated annually and utilize our historical database of
actual defaults and other data. The loan risk ratings and
composition of the commercial portfolios used to calculate the
allowance are updated quarterly to incorporate the most recent
data reflecting the current economic environment. For risk-rated
commercial loans, we estimate the probability of default and the
LGD based on our historical experience of defaults and credit
losses. Factors considered when assessing the internal risk rating
include the value of the underlying collateral, if applicable, the
industry in which the obligor operates, the obligor’s liquidity and
other financial indicators, and other quantitative and qualitative
factors relevant to the obligor’s credit risk. As of December 31,
2014, the allowance increased for all major commercial portfolios
compared to December 31, 2013.
Also included within the second component of the allowance
for loan and lease losses are reserves to cover losses that are
incurred but, in our assessment, may not be adequately
represented in the historical loss data used in the loss forecast
models. For example, factors that we consider include, among
others, changes in lending policies and procedures, changes in
economic and business conditions, changes in the nature and size
of the portfolio, changes in portfolio concentrations, changes in
the volume and severity of past due loans and nonaccrual loans,
the effect of external factors such as competition, and legal and
regulatory requirements. We also consider factors that are
applicable to unique portfolio segments. For example, we consider
the risk of uncertainty in our loss forecasting models related to
junior-lien home equity loans that are current, but have first-lien
loans that we do not service that are 30 days or more past due.
In addition, we consider the increased risk of default associated
with our interest-only loans that have yet to enter the amortization
period. Further, we consider the inherent uncertainty in
mathematical models that are built upon historical data.
During 2014, the factors that impacted the allowance for loan
and lease losses included overall improvements in the credit
quality of the portfolios driven by continuing improvements in the
U.S. economy and housing and labor markets, continuing proactive
credit risk management initiatives and the impact of recent higher
credit quality originations. Additionally, the resolution of
uncertainties through current recognition of net charge-offs has
impacted the amount of reserve needed in certain portfolios.
Evidencing the improvements in the U.S. economy and housing
and labor markets are modest growth in consumer spending,
improvements in unemployment levels, a decrease in the absolute
level and our share of national consumer bankruptcy filings, and
a rise in both residential building activity and overall home prices.
In addition to these improvements, paydowns, charge-offs, sales,
returns to performing status and upgrades out of criticized
continued to outpace new nonaccrual loans and reservable
criticized commercial loans.
We monitor differences between estimated and actual incurred
loan and lease losses. This monitoring process includes periodic
assessments by senior management of loan and lease portfolios
and the models used to estimate incurred losses in those
portfolios.
Additions to, or reductions of, the allowance for loan and lease
losses generally are recorded through charges or credits to the
provision for credit losses. Credit exposures deemed to be
uncollectible are charged against the allowance for loan and lease
losses. Recoveries of previously charged off amounts are credited
to the allowance for loan and lease losses.
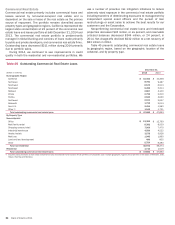
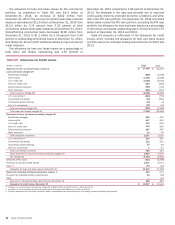
The allowance for loan and lease losses for the consumer
portfolio, as presented in Table 60, was $10.0 billion at
December 31, 2014, a decrease of $3.4 billion from
December 31, 2013. The decrease was primarily in the residential
mortgage and home equity portfolios due to increased home
prices, as evidenced by improving LTV statistics as presented in
Tables 28 and 30, improved delinquencies and a decrease in
consumer loan balances. Further, the residential mortgage and
home equity allowance declined due to write-offs in our PCI loan
portfolio. These write-offs decreased the PCI valuation allowance
included as part of the allowance for loan and lease losses.
The decrease in the allowance related to the U.S. credit card
and unsecured consumer lending portfolios in CBB was primarily
due to improvement in delinquencies and bankruptcies. For
example, in the U.S. credit card portfolio, accruing loans 30 days
or more past due decreased to $1.7 billion at December 31, 2014
from $2.1 billion (to 1.85 percent from 2.25 percent of outstanding
U.S. credit card loans) at December 31, 2013, and accruing loans
90 days or more past due decreased to $866 million at
December 31, 2014 from $1.1 billion (to 0.94 percent from 1.14
percent of outstanding U.S. credit card loans) at December 31,
2013. See Tables 25, 26, 35 and 37 for additional details on key
credit statistics for the credit card and other unsecured consumer
lending portfolios.