Bank of America 2014 Annual Report Download - page 232
Download and view the complete annual report
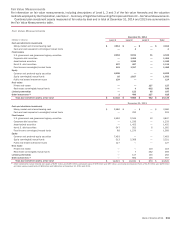
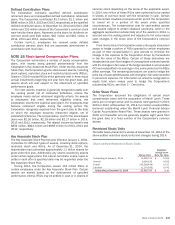
Please find page 232 of the 2014 Bank of America annual report below. You can navigate through the pages in the report by either clicking on the pages listed below, or by using the keyword search tool below to find specific information within the annual report.-
 1
1 -
2
-
3
-
4
-
5
-
6
-
7
-
8
-
9
-
10
-
11
-
12
-
13
-
14
-
15
-
16
-
17
-
18
-
19
-
20
-
21
-
22
-
23
-
24
-
25
-
26
-
27
-
28
-
29
-
30
-
31
-
32
-
33
-
34
-
35
-
36
-
37
-
38
-
39
-
40
-
41
-
42
-
43
-
44
-
45
-
46
-
47
-
48
-
49
-
50
-
51
-
52
-
53
-
54
-
55
-
56
-
57
-
58
-
59
-
60
-
61
-
62
-
63
-
64
-
65
-
66
-
67
-
68
-
69
-
70
-
71
-
72
-
73
-
74
-
75
-
76
-
77
-
78
-
79
-
80
-
81
-
82
-
83
-
84
-
85
-
86
-
87
-
88
-
89
-
90
-
91
-
92
-
93
-
94
-
95
-
96
-
97
-
98
-
99
-
100
-
101
-
102
-
103
-
104
-
105
-
106
-
107
-
108
-
109
-
110
-
111
-
112
-
113
-
114
-
115
-
116
-
117
-
118
-
119
-
120
-
121
-
122
-
123
-
124
-
125
-
126
-
127
-
128
-
129
-
130
-
131
-
132
-
133
-
134
-
135
-
136
-
137
-
138
-
139
-
140
-
141
-
142
-
143
-
144
-
145
-
146
-
147
-
148
-
149
-
150
-
151
-
152
-
153
-
154
-
155
-
156
-
157
-
158
-
159
-
160
-
161
-
162
-
163
-
164
-
165
-
166
-
167
-
168
-
169
-
170
-
171
-
172
-
173
-
174
-
175
-
176
-
177
-
178
-
179
-
180
-
181
-
182
-
183
-
184
-
185
-
186
-
187
-
188
-
189
-
190
-
191
-
192
-
193
-
194
-
195
-
196
-
197
-
198
-
199
-
200
-
201
-
202
-
203
-
204
-
205
-
206
-
207
-
208
-
209
-
210
-
211
-
212
-
213
-
214
-
215
-
216
-
217
-
218
-
219
-
220
-
221
-
 222
222 -
 223
223 -
 224
224 -
 225
225 -
 226
226 -
 227
227 -
 228
228 -
 229
229 -
 230
230 -
 231
231 -
 232
232 -
 233
233 -
 234
234 -
 235
235 -
 236
236 -
 237
237 -
 238
238 -
 239
239 -
 240
240 -
 241
241 -
 242
242 -
243
-
244
-
245
-
246
-
247
-
248
-
249
-
250
-
251
-
252
-
253
-
254
-
255
-
256
-
257
-
258
-
259
-
260
-
261
-
262
-
263
-
264
-
265
-
266
-
267
-
268
-
269
-
270
-
271
-
272
 |
 |

230 Bank of America 2014
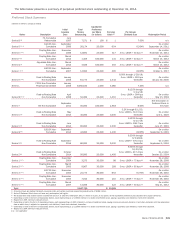
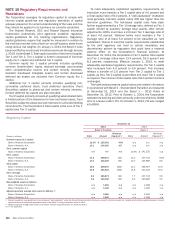
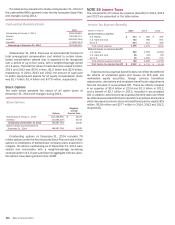
Pension Plans with ABO and PBO in excess of plan assets as of December 31, 2014 and 2013 are presented in the table below.
For the non-qualified plans not subject to ERISA or non-U.S. pension plans, funding strategies vary due to legal requirements and local
practices.
Plans with ABO and PBO in Excess of Plan Assets
Non-U.S.
Pension Plans
Nonqualified
and Other
Pension Plans
(Dollars in millions) 2014 2013 2014 2013
Plans with ABO in excess of plan assets
PBO $583 $ 617 $ 1,190 $ 1,129
ABO 563 606 1,190 1,126
Fair value of plan assets 206 290 22
Plans with PBO in excess of plan assets
PBO $583 $ 720 $ 1,190 $ 1,129
Fair value of plan assets 206 392 22
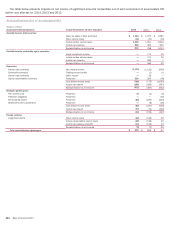
Net periodic benefit cost of the Corporation’s plans for 2014, 2013 and 2012 included the following components.
Components of Net Periodic Benefit Cost
Qualified Pension Plan Non-U.S. Pension Plans
(Dollars in millions) 2014 2013 2012 2014 2013 2012
Components of net periodic benefit cost
Service cost $—
$ — $ 236 $29 $32$40
Interest cost 665 623 681 109 98 97
Expected return on plan assets (1,018)(1,024) (1,246) (137)(121) (137)
Amortization of prior service cost ——91——
Amortization of net actuarial loss (gain) 111 242 469 32(9)
Recognized loss (gain) due to settlements and curtailments —17 58 2(7) —
Net periodic benefit cost (income) $ (242) $ (142) $ 207 $7
$4$(9)
Weighted-average assumptions used to determine net cost for years ended December 31
Discount rate 4.85%4.00% 4.95% 4.30%4.23% 4.87%
Expected return on plan assets 6.00 6.50 8.00 5.52 5.50 6.65
Rate of compensation increase n/a n/a 4.00 4.91 4.37 4.42
Nonqualified and
Other Pension Plans
Postretirement Health
and Life Plans
(Dollars in millions) 2014 2013 2012 2014 2013 2012
Components of net periodic benefit cost
Service cost $1
$1$1
$8
$9$
13
Interest cost 133 120 138 58 54 71
Expected return on plan assets (124) (109) (152) (4)(5) (8)
Amortization of transition obligation —————32
Amortization of prior service cost (credits) ——(3)444
Amortization of net actuarial loss (gain) 25 25 8 (89) (42) (38)
Recognized loss due to settlements and curtailments —2——6—
Net periodic benefit cost (income) $ 35 $39$ (8)
$(23)
$26$74
Weighted-average assumptions used to determine net cost for years ended December 31
Discount rate 4.55%3.65% 4.65% 4.50%3.65% 4.65%
Expected return on plan assets 4.60 3.75 5.25 6.00 6.50 8.00
Rate of compensation increase 4.00 4.00 4.00 n/a n/a n/a
n/a = not applicable
The asset valuation method used to calculate the expected
return on plan assets component of net period benefit cost for the
Qualified Pension Plan recognizes 60 percent of the prior year’s
market gains or losses at the next measurement date with the
remaining 40 percent spread equally over the subsequent four
years.
Net periodic postretirement health and life expense was
determined using the “projected unit credit” actuarial method.
Gains and losses for all benefit plans except postretirement health
care are recognized in accordance with the standard amortization
provisions of the applicable accounting guidance. For the
Postretirement Health Care Plans, 50 percent of the unrecognized
gain or loss at the beginning of the fiscal year (or at subsequent
remeasurement) is recognized on a level basis during the year.
Assumed health care cost trend rates affect the postretirement
benefit obligation and benefit cost reported for the Postretirement
Health and Life Plans. The assumed health care cost trend rate
used to measure the expected cost of benefits covered by the