Bank of America 2014 Annual Report Download - page 84
Download and view the complete annual report
Please find page 84 of the 2014 Bank of America annual report below. You can navigate through the pages in the report by either clicking on the pages listed below, or by using the keyword search tool below to find specific information within the annual report.-
 1
1 -
2
-
3
-
4
-
5
-
6
-
7
-
8
-
9
-
10
-
11
-
12
-
13
-
14
-
15
-
16
-
17
-
18
-
19
-
20
-
21
-
22
-
23
-
24
-
25
-
26
-
27
-
28
-
29
-
30
-
31
-
32
-
33
-
34
-
35
-
36
-
37
-
38
-
39
-
40
-
41
-
42
-
43
-
44
-
45
-
46
-
47
-
48
-
49
-
50
-
51
-
52
-
53
-
54
-
55
-
56
-
57
-
58
-
59
-
60
-
61
-
62
-
63
-
64
-
65
-
66
-
67
-
68
-
69
-
70
-
71
-
72
-
73
-
 74
74 -
 75
75 -
 76
76 -
 77
77 -
 78
78 -
 79
79 -
 80
80 -
 81
81 -
 82
82 -
 83
83 -
 84
84 -
 85
85 -
 86
86 -
 87
87 -
 88
88 -
 89
89 -
 90
90 -
 91
91 -
 92
92 -
 93
93 -
 94
94 -
95
-
96
-
97
-
98
-
99
-
100
-
101
-
102
-
103
-
104
-
105
-
106
-
107
-
108
-
109
-
110
-
111
-
112
-
113
-
114
-
115
-
116
-
117
-
118
-
119
-
120
-
121
-
122
-
123
-
124
-
125
-
126
-
127
-
128
-
129
-
130
-
131
-
132
-
133
-
134
-
135
-
136
-
137
-
138
-
139
-
140
-
141
-
142
-
143
-
144
-
145
-
146
-
147
-
148
-
149
-
150
-
151
-
152
-
153
-
154
-
155
-
156
-
157
-
158
-
159
-
160
-
161
-
162
-
163
-
164
-
165
-
166
-
167
-
168
-
169
-
170
-
171
-
172
-
173
-
174
-
175
-
176
-
177
-
178
-
179
-
180
-
181
-
182
-
183
-
184
-
185
-
186
-
187
-
188
-
189
-
190
-
191
-
192
-
193
-
194
-
195
-
196
-
197
-
198
-
199
-
200
-
201
-
202
-
203
-
204
-
205
-
206
-
207
-
208
-
209
-
210
-
211
-
212
-
213
-
214
-
215
-
216
-
217
-
218
-
219
-
220
-
221
-
222
-
223
-
224
-
225
-
226
-
227
-
228
-
229
-
230
-
231
-
232
-
233
-
234
-
235
-
236
-
237
-
238
-
239
-
240
-
241
-
242
-
243
-
244
-
245
-
246
-
247
-
248
-
249
-
250
-
251
-
252
-
253
-
254
-
255
-
256
-
257
-
258
-
259
-
260
-
261
-
262
-
263
-
264
-
265
-
266
-
267
-
268
-
269
-
270
-
271
-
272
 |
 |

82 Bank of America 2014
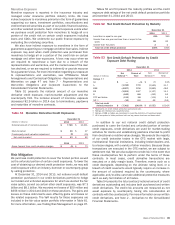
In addition, the Corporation is a member of various securities
and derivative exchanges and clearinghouses, both in the U.S. and
other countries. As a member, the Corporation may be required to
pay a pro-rata share of the losses incurred by some of these
organizations as a result of another member default and under
other loss scenarios. For additional information, see Note 12 –
Commitments and Contingencies to the Consolidated Financial
Statements.
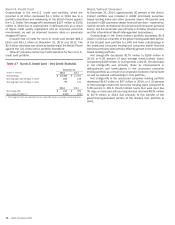
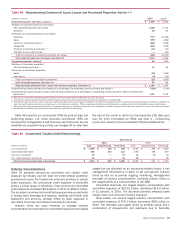
Commercial Credit Portfolio
During 2014, tightening of credit spreads, combined with improved
commercial real estate pricing and higher equity markets, drove
further improvements in commercial credit quality. Our focus on
balance sheet optimization drove new originations to be weighted
to higher rated investment-grade obligors.
Outstanding commercial loans and leases decreased $3.5
billion, primarily in non-U.S. commercial, partially offset by growth
in U.S. commercial. Credit quality continued to show improvement
with declines in reservable criticized balances and nonperforming
loans, leases and foreclosed property balances during 2014.
Nonperforming commercial loans and leases as a percentage of
outstanding commercial loans and leases decreased during 2014
to 0.28 percent from 0.33 percent (0.29 percent from 0.34 percent
excluding loans accounted for under the fair value option) at
December 31, 2013. The allowance for loan and lease losses for
the commercial portfolio increased $432 million to $4.4 billion at
December 31, 2014 compared to December 31, 2013. For more
information, see Allowance for Credit Losses on page 92.
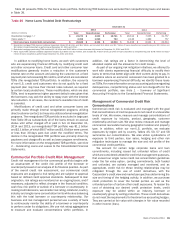
Table 41 presents our commercial loans and leases portfolio,
and related credit quality information at December 31, 2014 and
2013.
Table 41 Commercial Loans and Leases
December 31
Outstandings Nonperforming
Accruing Past Due
90 Days or More
(Dollars in millions) 2014 2013 2014 2013 2014 2013
U.S. commercial $ 220,293 $212,557 $701 $ 819 $110 $47
Commercial real estate (1) 47,682 47,893 321 322 321
Commercial lease financing 24,866 25,199 316 41 41
Non-U.S. commercial 80,083 89,462 164 —17
372,924 375,111 1,026 1,221 154 126
U.S. small business commercial (2) 13,293 13,294 87 88 67 78
Commercial loans excluding loans accounted for under the fair value option 386,217 388,405 1,113 1,309 221 204
Loans accounted for under the fair value option (3) 6,604 7,878 —2——
Total commercial loans and leases $ 392,821 $396,283 $ 1,113 $ 1,311 $221 $ 204
(1) Includes U.S. commercial real estate loans of $45.2 billion and $46.3 billion and non-U.S. commercial real estate loans of $2.5 billion and $1.6 billion at December 31, 2014 and 2013.
(2) Includes card-related products.
(3) Commercial loans accounted for under the fair value option include U.S. commercial loans of $1.9 billion and $1.5 billion and non-U.S. commercial loans of $4.7 billion and $6.4 billion at December
31, 2014 and 2013. For more information on the fair value option, see Note 21 – Fair Value Option to the Consolidated Financial Statements.
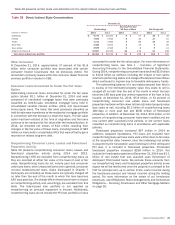
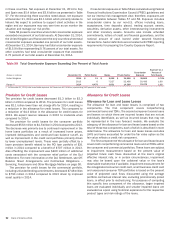
Table 42 presents net charge-offs and related ratios for our commercial loans and leases for 2014 and 2013. Improving trends
across the portfolio drove lower charge-offs.
Table 42 Commercial Net Charge-offs and Related Ratios
Net Charge-offs Net Charge-off Ratios (1)
(Dollars in millions) 2014 2013 2014 2013
U.S. commercial $88
$ 128 0.04%0.06%
Commercial real estate (83) 149 (0.18) 0.35
Commercial lease financing (9) (25) (0.04) (0.10)
Non-U.S. commercial 34 45 0.04 0.05
30 297 0.01 0.08
U.S. small business commercial 282 359 2.10 2.84
Total commercial $ 312 $ 656 0.08 0.18
(1) Net charge-off ratios are calculated as net charge-offs divided by average outstanding loans and leases excluding loans accounted for under the fair value option.