Bank of America 2014 Annual Report Download - page 257
Download and view the complete annual report
Please find page 257 of the 2014 Bank of America annual report below. You can navigate through the pages in the report by either clicking on the pages listed below, or by using the keyword search tool below to find specific information within the annual report.-
 1
1 -
2
-
3
-
4
-
5
-
6
-
7
-
8
-
9
-
10
-
11
-
12
-
13
-
14
-
15
-
16
-
17
-
18
-
19
-
20
-
21
-
22
-
23
-
24
-
25
-
26
-
27
-
28
-
29
-
30
-
31
-
32
-
33
-
34
-
35
-
36
-
37
-
38
-
39
-
40
-
41
-
42
-
43
-
44
-
45
-
46
-
47
-
48
-
49
-
50
-
51
-
52
-
53
-
54
-
55
-
56
-
57
-
58
-
59
-
60
-
61
-
62
-
63
-
64
-
65
-
66
-
67
-
68
-
69
-
70
-
71
-
72
-
73
-
74
-
75
-
76
-
77
-
78
-
79
-
80
-
81
-
82
-
83
-
84
-
85
-
86
-
87
-
88
-
89
-
90
-
91
-
92
-
93
-
94
-
95
-
96
-
97
-
98
-
99
-
100
-
101
-
102
-
103
-
104
-
105
-
106
-
107
-
108
-
109
-
110
-
111
-
112
-
113
-
114
-
115
-
116
-
117
-
118
-
119
-
120
-
121
-
122
-
123
-
124
-
125
-
126
-
127
-
128
-
129
-
130
-
131
-
132
-
133
-
134
-
135
-
136
-
137
-
138
-
139
-
140
-
141
-
142
-
143
-
144
-
145
-
146
-
147
-
148
-
149
-
150
-
151
-
152
-
153
-
154
-
155
-
156
-
157
-
158
-
159
-
160
-
161
-
162
-
163
-
164
-
165
-
166
-
167
-
168
-
169
-
170
-
171
-
172
-
173
-
174
-
175
-
176
-
177
-
178
-
179
-
180
-
181
-
182
-
183
-
184
-
185
-
186
-
187
-
188
-
189
-
190
-
191
-
192
-
193
-
194
-
195
-
196
-
197
-
198
-
199
-
200
-
201
-
202
-
203
-
204
-
205
-
206
-
207
-
208
-
209
-
210
-
211
-
212
-
213
-
214
-
215
-
216
-
217
-
218
-
219
-
220
-
221
-
222
-
223
-
224
-
225
-
226
-
227
-
228
-
229
-
230
-
231
-
232
-
233
-
234
-
235
-
236
-
237
-
238
-
239
-
240
-
241
-
242
-
243
-
244
-
245
-
246
-
 247
247 -
 248
248 -
 249
249 -
 250
250 -
 251
251 -
 252
252 -
 253
253 -
 254
254 -
 255
255 -
 256
256 -
 257
257 -
 258
258 -
 259
259 -
 260
260 -
 261
261 -
 262
262 -
 263
263 -
 264
264 -
 265
265 -
 266
266 -
 267
267 -
268
-
269
-
270
-
271
-
272
 |
 |

Bank of America 2014 255
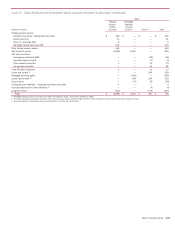
The table below provides information about where changes in the fair value of assets and liabilities accounted for under the fair
value option are included in the Consolidated Statement of Income for 2014, 2013 and 2012.
Gains (Losses) Relating to Assets and Liabilities Accounted for Under the Fair Value Option
2014
(Dollars in millions)
Trading
Account
Profits
(Losses)
Mortgage
Banking
Income
(Loss)
Other
Income
(Loss) Total
Loans reported as trading account assets $(87)$ —$ —$(87)
Trading inventory other (1) 1,091 — —1,091
Consumer and commercial loans (24) — 69 45
Loans held-for-sale (2) (56) 798 83 825
Securities financing agreements (110) — —(110)
Long-term deposits 23 — (26) (3)
Unfunded loan commitments — — (64) (64)
Short-term borrowings 52 — —52
Long-term debt (3) 239 —407 646
Total $ 1,128 $ 798 $469 $ 2,395
2013
Loans reported as trading account assets $ 83 $ — $ — $ 83
Trading inventory other (1) 1,355 — — 1,355
Consumer and commercial loans (28) (38) 240 174
Loans held-for-sale (2) 7 966 75 1,048
Securities financing agreements (80) — — (80)
Other assets — — (77) (77)
Long-term deposits 30 — 84 114
Asset-backed secured financings — (91) — (91)
Unfunded loan commitments — — 180 180
Short-term borrowings (70) — — (70)
Long-term debt (3) (602) — (649) (1,251)
Total $ 695 $ 837 $ (147) $ 1,385
2012
Loans reported as trading account assets $ 232 $ — $ — $ 232
Trading inventory – other (1) 659 — — 659
Consumer and commercial loans 17 — 542 559
Loans held-for-sale (2) 75 3,048 190 3,313
Securities financing agreements (90) — — (90)
Other assets — — 12 12
Long-term deposits — — 29 29
Asset-backed secured financings — (180) — (180)
Unfunded loan commitments — — 704 704
Short-term borrowings 1—— 1
Long-term debt (3) (1,888) — (5,107) (6,995)
Total $ (994) $ 2,868 $ (3,630) $ (1,756)
(1) The gains (losses) in trading account profits (losses) are primarily offset by gains (losses) on trading liabilities that hedge these assets.
(2) Includes the value of interest rate lock commitments on loans funded, including those sold during the period.
(3) The majority of the net gains (losses) in trading account profits (losses) relate to the embedded derivative in structured liabilities and are offset by gains (losses) on derivatives and securities that
hedge these liabilities. The net gains (losses) in other income (loss) relate to the impact on structured liabilities of changes in the Corporation’s credit spreads.
NOTE 22 Fair Value of Financial Instruments
The fair values of financial instruments and their classifications
within the fair value hierarchy have been derived using
methodologies described in Note 20 – Fair Value Measurements.
The following disclosures include financial instruments where only
a portion of the ending balance at December 31, 2014 and 2013
was carried at fair value on the Consolidated Balance Sheet.
Short-term Financial Instruments
The carrying value of short-term financial instruments, including
cash and cash equivalents, time deposits placed and other short-
term investments, federal funds sold and purchased, certain
resale and repurchase agreements, customer and other
receivables, customer payables (within accrued expenses and
other liabilities on the Consolidated Balance Sheet), and short-
term borrowings approximates the fair value of these instruments.
These financial instruments generally expose the Corporation to
limited credit risk and have no stated maturities or have short-
term maturities and carry interest rates that approximate market.
The Corporation elected to account for certain resale and
repurchase agreements under the fair value option.
Under the fair value hierarchy, cash and cash equivalents are
classified as Level 1. Time deposits placed and other short-term
investments, such as U.S. government securities and short-term
commercial paper, are classified as Level 1 and Level 2. Federal