Bank of America 2014 Annual Report Download - page 83
Download and view the complete annual report
Please find page 83 of the 2014 Bank of America annual report below. You can navigate through the pages in the report by either clicking on the pages listed below, or by using the keyword search tool below to find specific information within the annual report.-
 1
1 -
2
-
3
-
4
-
5
-
6
-
7
-
8
-
9
-
10
-
11
-
12
-
13
-
14
-
15
-
16
-
17
-
18
-
19
-
20
-
21
-
22
-
23
-
24
-
25
-
26
-
27
-
28
-
29
-
30
-
31
-
32
-
33
-
34
-
35
-
36
-
37
-
38
-
39
-
40
-
41
-
42
-
43
-
44
-
45
-
46
-
47
-
48
-
49
-
50
-
51
-
52
-
53
-
54
-
55
-
56
-
57
-
58
-
59
-
60
-
61
-
62
-
63
-
64
-
65
-
66
-
67
-
68
-
69
-
70
-
71
-
72
-
 73
73 -
 74
74 -
 75
75 -
 76
76 -
 77
77 -
 78
78 -
 79
79 -
 80
80 -
 81
81 -
 82
82 -
 83
83 -
 84
84 -
 85
85 -
 86
86 -
 87
87 -
 88
88 -
 89
89 -
 90
90 -
 91
91 -
 92
92 -
 93
93 -
94
-
95
-
96
-
97
-
98
-
99
-
100
-
101
-
102
-
103
-
104
-
105
-
106
-
107
-
108
-
109
-
110
-
111
-
112
-
113
-
114
-
115
-
116
-
117
-
118
-
119
-
120
-
121
-
122
-
123
-
124
-
125
-
126
-
127
-
128
-
129
-
130
-
131
-
132
-
133
-
134
-
135
-
136
-
137
-
138
-
139
-
140
-
141
-
142
-
143
-
144
-
145
-
146
-
147
-
148
-
149
-
150
-
151
-
152
-
153
-
154
-
155
-
156
-
157
-
158
-
159
-
160
-
161
-
162
-
163
-
164
-
165
-
166
-
167
-
168
-
169
-
170
-
171
-
172
-
173
-
174
-
175
-
176
-
177
-
178
-
179
-
180
-
181
-
182
-
183
-
184
-
185
-
186
-
187
-
188
-
189
-
190
-
191
-
192
-
193
-
194
-
195
-
196
-
197
-
198
-
199
-
200
-
201
-
202
-
203
-
204
-
205
-
206
-
207
-
208
-
209
-
210
-
211
-
212
-
213
-
214
-
215
-
216
-
217
-
218
-
219
-
220
-
221
-
222
-
223
-
224
-
225
-
226
-
227
-
228
-
229
-
230
-
231
-
232
-
233
-
234
-
235
-
236
-
237
-
238
-
239
-
240
-
241
-
242
-
243
-
244
-
245
-
246
-
247
-
248
-
249
-
250
-
251
-
252
-
253
-
254
-
255
-
256
-
257
-
258
-
259
-
260
-
261
-
262
-
263
-
264
-
265
-
266
-
267
-
268
-
269
-
270
-
271
-
272
 |
 |

Bank of America 2014 81
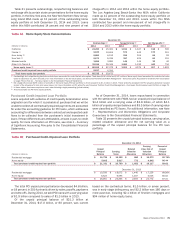
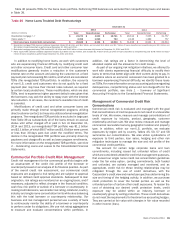
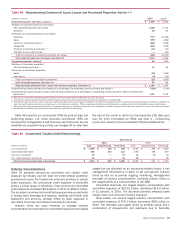
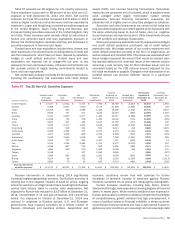
Table 40 presents TDRs for the home loans portfolio. Performing TDR balances are excluded from nonperforming loans and leases
in Table 39.
Table 40 Home Loans Troubled Debt Restructurings
December 31
2014 2013
(Dollars in millions) Total Nonperforming Performing Total Nonperforming Performing
Residential mortgage (1, 2) $ 23,270 $ 4,529 $ 18,741 $ 29,312 $ 7,555 $ 21,757
Home equity (3) 2,358 1,595 763 2,146 1,389 757
Total home loans troubled debt restructurings $ 25,628 $ 6,124 $ 19,504 $ 31,458 $ 8,944 $ 22,514
(1) Residential mortgage TDRs deemed collateral dependent totaled $5.8 billion and $8.2 billion, and included $3.6 billion and $5.7 billion of loans classified as nonperforming and $2.2 billion and
$2.5 billion of loans classified as performing at December 31, 2014 and 2013.
(2) Residential mortgage performing TDRs included $11.9 billion and $14.3 billion of loans that were fully-insured at December 31, 2014 and 2013.
(3) Home equity TDRs deemed collateral dependent totaled $1.6 billion and $1.4 billion, and included $1.4 billion and $1.2 billion of loans classified as nonperforming and $178 million and $227
million of loans classified as performing at December 31, 2014 and 2013.
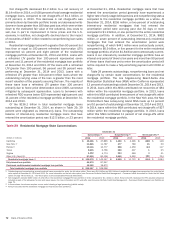
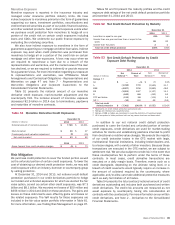
In addition to modifying home loans, we work with customers
who are experiencing financial difficulty by modifying credit card
and other consumer loans. Credit card and other consumer loan
modifications generally involve a reduction in the customer’s
interest rate on the account and placing the customer on a fixed
payment plan not exceeding 60 months, all of which are considered
TDRs (the renegotiated TDR portfolio). In addition, the accounts
of non-U.S. credit card customers who do not qualify for a fixed
payment plan may have their interest rates reduced, as required
by certain local jurisdictions. These modifications, which are also
TDRs, tend to experience higher payment default rates given that
the borrowers may lack the ability to repay even with the interest
rate reduction. In all cases, the customer’s available line of credit
is canceled.
Modifications of credit card and other consumer loans are
primarily made through internal renegotiation programs utilizing
direct customer contact, but may also utilize external renegotiation
programs. The renegotiated TDR portfolio is excluded in large part
from Table 39 as substantially all of the loans remain on accrual
status until either charged off or paid in full. At December 31,
2014 and 2013, our renegotiated TDR portfolio was $1.1 billion
and $2.1 billion, of which $907 million and $1.6 billion were current
or less than 30 days past due under the modified terms. The
decline in the renegotiated TDR portfolio was primarily driven by
paydowns and charge-offs as well as lower program enrollments.
For more information on the renegotiated TDR portfolio, see Note
4 – Outstanding Loans and Leases to the Consolidated Financial
Statements.
Commercial Portfolio Credit Risk Management
Credit risk management for the commercial portfolio begins with
an assessment of the credit risk profile of the borrower or
counterparty based on an analysis of its financial position. As part
of the overall credit risk assessment, our commercial credit
exposures are assigned a risk rating and are subject to approval
based on defined credit approval standards. Subsequent to loan
origination, risk ratings are monitored on an ongoing basis, and if
necessary, adjusted to reflect changes in the financial condition,
cash flow, risk profile or outlook of a borrower or counterparty. In
making credit decisions, we consider risk rating, collateral, country,
industry and single name concentration limits while also balancing
this with the total borrower or counterparty relationship. Our
business and risk management personnel use a variety of tools
to continuously monitor the ability of a borrower or counterparty
to perform under its obligations. We use risk rating aggregations
to measure and evaluate concentrations within portfolios. In
addition, risk ratings are a factor in determining the level of
allocated capital and the allowance for credit losses.
As part of our ongoing risk mitigation initiatives, we attempt to
work with clients experiencing financial difficulty to modify their
loans to terms that better align with their current ability to pay. In
situations where an economic concession has been granted to a
borrower experiencing financial difficulty, we identify these loans
as TDRs. For more information on our accounting policies regarding
delinquencies, nonperforming status and net charge-offs for the
commercial portfolio, see Note 1 – Summary of Significant
Accounting Principles to the Consolidated Financial Statements.
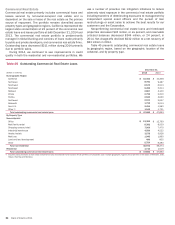
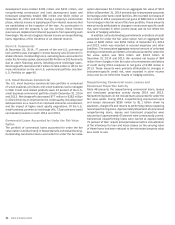
Management of Commercial Credit Risk
Concentrations
Commercial credit risk is evaluated and managed with the goal
that concentrations of credit exposure do not result in undesirable
levels of risk. We review, measure and manage concentrations of
credit exposure by industry, product, geography, customer
relationship and loan size. We also review, measure and manage
commercial real estate loans by geographic location and property
type. In addition, within our non-U.S. portfolio, we evaluate
exposures by region and by country. Tables 45, 50, 57 and 58
summarize our concentrations. We also utilize syndications of
exposure to third parties, loan sales, hedging and other risk
mitigation techniques to manage the size and risk profile of the
commercial credit portfolio.
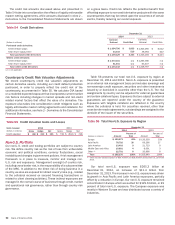
We account for certain large corporate loans and loan
commitments, including issued but unfunded letters of credit
which are considered utilized for credit risk management purposes,
that exceed our single name credit risk concentration guidelines
under the fair value option. Lending commitments, both funded
and unfunded, are actively managed and monitored, and as
appropriate, credit risk for these lending relationships may be
mitigated through the use of credit derivatives, with the
Corporation’s credit view and market perspectives determining the
size and timing of the hedging activity. In addition, we purchase
credit protection to cover the funded portion as well as the
unfunded portion of certain other credit exposures. To lessen the
cost of obtaining our desired credit protection levels, credit
exposure may be added within an industry, borrower or
counterparty group by selling protection. These credit derivatives
do not meet the requirements for treatment as accounting hedges.
They are carried at fair value with changes in fair value recorded
in other income (loss).