Bank of America 2014 Annual Report Download - page 78
Download and view the complete annual report
Please find page 78 of the 2014 Bank of America annual report below. You can navigate through the pages in the report by either clicking on the pages listed below, or by using the keyword search tool below to find specific information within the annual report.-
 1
1 -
2
-
3
-
4
-
5
-
6
-
7
-
8
-
9
-
10
-
11
-
12
-
13
-
14
-
15
-
16
-
17
-
18
-
19
-
20
-
21
-
22
-
23
-
24
-
25
-
26
-
27
-
28
-
29
-
30
-
31
-
32
-
33
-
34
-
35
-
36
-
37
-
38
-
39
-
40
-
41
-
42
-
43
-
44
-
45
-
46
-
47
-
48
-
49
-
50
-
51
-
52
-
53
-
54
-
55
-
56
-
57
-
58
-
59
-
60
-
61
-
62
-
63
-
64
-
65
-
66
-
67
-
 68
68 -
 69
69 -
 70
70 -
 71
71 -
 72
72 -
 73
73 -
 74
74 -
 75
75 -
 76
76 -
 77
77 -
 78
78 -
 79
79 -
 80
80 -
 81
81 -
 82
82 -
 83
83 -
 84
84 -
 85
85 -
 86
86 -
 87
87 -
 88
88 -
89
-
90
-
91
-
92
-
93
-
94
-
95
-
96
-
97
-
98
-
99
-
100
-
101
-
102
-
103
-
104
-
105
-
106
-
107
-
108
-
109
-
110
-
111
-
112
-
113
-
114
-
115
-
116
-
117
-
118
-
119
-
120
-
121
-
122
-
123
-
124
-
125
-
126
-
127
-
128
-
129
-
130
-
131
-
132
-
133
-
134
-
135
-
136
-
137
-
138
-
139
-
140
-
141
-
142
-
143
-
144
-
145
-
146
-
147
-
148
-
149
-
150
-
151
-
152
-
153
-
154
-
155
-
156
-
157
-
158
-
159
-
160
-
161
-
162
-
163
-
164
-
165
-
166
-
167
-
168
-
169
-
170
-
171
-
172
-
173
-
174
-
175
-
176
-
177
-
178
-
179
-
180
-
181
-
182
-
183
-
184
-
185
-
186
-
187
-
188
-
189
-
190
-
191
-
192
-
193
-
194
-
195
-
196
-
197
-
198
-
199
-
200
-
201
-
202
-
203
-
204
-
205
-
206
-
207
-
208
-
209
-
210
-
211
-
212
-
213
-
214
-
215
-
216
-
217
-
218
-
219
-
220
-
221
-
222
-
223
-
224
-
225
-
226
-
227
-
228
-
229
-
230
-
231
-
232
-
233
-
234
-
235
-
236
-
237
-
238
-
239
-
240
-
241
-
242
-
243
-
244
-
245
-
246
-
247
-
248
-
249
-
250
-
251
-
252
-
253
-
254
-
255
-
256
-
257
-
258
-
259
-
260
-
261
-
262
-
263
-
264
-
265
-
266
-
267
-
268
-
269
-
270
-
271
-
272
 |
 |

76 Bank of America 2014
During 2014, we recorded a provision benefit of $31 million
for the PCI loan portfolio including $21 million for residential
mortgage and $10 million for home equity. This compared to a
total provision benefit of $707 million in 2013. The provision
benefit in 2014 was primarily driven by changes in liquidation
assumptions and improved macro-economic conditions.
The PCI valuation allowance declined $841 million during 2014
due to write-offs in the PCI loan portfolio of $545 million in
residential mortgage and $265 million in home equity, and a
provision benefit of $31 million.
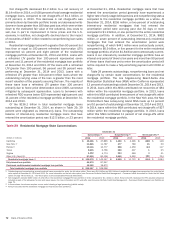
Purchased Credit-impaired Residential Mortgage Loan
Portfolio
The PCI residential mortgage loan portfolio represented 73 percent
of the total PCI loan portfolio at December 31, 2014. Those loans
to borrowers with a refreshed FICO score below 620 represented
40 percent of the PCI residential mortgage loan portfolio at
December 31, 2014. Loans with a refreshed LTV greater than
90 percent, after consideration of purchase accounting
adjustments and the related valuation allowance, represented 34
percent of the PCI residential mortgage loan portfolio and 46
percent based on the unpaid principal balance at December 31,
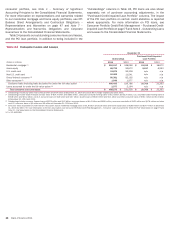
2014. Table 33 presents outstandings net of purchase accounting
adjustments and before the related valuation allowance, by certain
state concentrations.
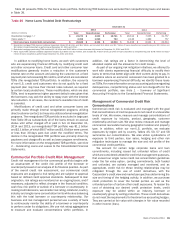
Table 33 Outstanding Purchased Credit-impaired Loan
Portfolio – Residential Mortgage State
Concentrations
December 31
(Dollars in millions) 2014 2013
California $ 6,885 $ 8,180
Florida (1) 1,289 1,750
Virginia 640 760
Maryland 602 728
Texas 318 433
Other U.S./Non-U.S. 5,418 6,821
Total $ 15,152 $ 18,672
(1) In this state, foreclosure requires a court order following a legal proceeding (judicial state).
Pay option adjustable-rate mortgages (ARMs), which are
included in the PCI residential mortgage portfolio, have interest
rates that adjust monthly and minimum required payments that
adjust annually, subject to resetting if minimum payments are
made and deferred interest limits are reached. Annual payment
adjustments are subject to a 7.5 percent maximum change. To
ensure that contractual loan payments are adequate to repay a
loan, the fully-amortizing loan payment amount is re-established
after the initial five- or ten-year period and again every five years
thereafter. These payment adjustments are not subject to the 7.5
percent limit and may be substantial due to changes in interest
rates and the addition of unpaid interest to the loan balance.
Payment advantage ARMs have interest rates that are fixed for an
initial period of five years. Payments are subject to reset if the
minimum payments are made and deferred interest limits are
reached. If interest deferrals cause a loan’s principal balance to
reach a certain level within the first 10 years of the life of the loan,
the payment is reset to the interest-only payment; then at the 10-
year point, the fully-amortizing payment is required.
The difference between the frequency of changes in a loan’s
interest rates and payments along with a limitation on changes in
the minimum monthly payments of 7.5 percent per year can result
in payments that are not sufficient to pay all of the monthly interest
charges (i.e., negative amortization). Unpaid interest is added to
the loan balance until the loan balance increases to a specified
limit, which can be no more than 115 percent of the original loan
amount, at which time a new monthly payment amount adequate
to repay the loan over its remaining contractual life is established.
At December 31, 2014, the unpaid principal balance of pay
option loans, which include pay option ARMs and payment
advantage ARMs, was $3.3 billion, with a carrying value of $3.2
billion, including $2.8 billion of loans that were credit-impaired
upon acquisition and, accordingly, the reserve is based on a life-
of-loan loss estimate. The total unpaid principal balance of pay
option loans with accumulated negative amortization was $1.1
billion, including $63 million of negative amortization. For those
borrowers who are making payments in accordance with their
contractual terms, one percent and five percent at December 31,
2014 and 2013 elected to make only the minimum payment on
pay option loans. We believe the majority of borrowers are now
making scheduled payments primarily because the low rate
environment has caused the fully indexed rates to be affordable
to more borrowers. We continue to evaluate our exposure to
payment resets on the acquired negative-amortizing loans
including the PCI pay option loan portfolio and have taken into
consideration in the evaluation several assumptions including
prepayment and default rates. Of the loans in the pay option
portfolio at December 31, 2014 that have not already experienced
a payment reset, two percent are expected to reset in 2015, 32
percent are expected to reset in 2016 and 11 percent are expected
to reset thereafter. In addition, 18 percent are expected to prepay
and approximately 37 percent are expected to default prior to being
reset, most of which were severely delinquent as of December 31,
2014. We no longer originate pay option loans.