Bank of America 2014 Annual Report Download - page 166
Download and view the complete annual report
Please find page 166 of the 2014 Bank of America annual report below. You can navigate through the pages in the report by either clicking on the pages listed below, or by using the keyword search tool below to find specific information within the annual report.-
 1
1 -
2
-
3
-
4
-
5
-
6
-
7
-
8
-
9
-
10
-
11
-
12
-
13
-
14
-
15
-
16
-
17
-
18
-
19
-
20
-
21
-
22
-
23
-
24
-
25
-
26
-
27
-
28
-
29
-
30
-
31
-
32
-
33
-
34
-
35
-
36
-
37
-
38
-
39
-
40
-
41
-
42
-
43
-
44
-
45
-
46
-
47
-
48
-
49
-
50
-
51
-
52
-
53
-
54
-
55
-
56
-
57
-
58
-
59
-
60
-
61
-
62
-
63
-
64
-
65
-
66
-
67
-
68
-
69
-
70
-
71
-
72
-
73
-
74
-
75
-
76
-
77
-
78
-
79
-
80
-
81
-
82
-
83
-
84
-
85
-
86
-
87
-
88
-
89
-
90
-
91
-
92
-
93
-
94
-
95
-
96
-
97
-
98
-
99
-
100
-
101
-
102
-
103
-
104
-
105
-
106
-
107
-
108
-
109
-
110
-
111
-
112
-
113
-
114
-
115
-
116
-
117
-
118
-
119
-
120
-
121
-
122
-
123
-
124
-
125
-
126
-
127
-
128
-
129
-
130
-
131
-
132
-
133
-
134
-
135
-
136
-
137
-
138
-
139
-
140
-
141
-
142
-
143
-
144
-
145
-
146
-
147
-
148
-
149
-
150
-
151
-
152
-
153
-
154
-
155
-
 156
156 -
 157
157 -
 158
158 -
 159
159 -
 160
160 -
 161
161 -
 162
162 -
 163
163 -
 164
164 -
 165
165 -
 166
166 -
 167
167 -
 168
168 -
 169
169 -
 170
170 -
 171
171 -
 172
172 -
 173
173 -
 174
174 -
 175
175 -
 176
176 -
177
-
178
-
179
-
180
-
181
-
182
-
183
-
184
-
185
-
186
-
187
-
188
-
189
-
190
-
191
-
192
-
193
-
194
-
195
-
196
-
197
-
198
-
199
-
200
-
201
-
202
-
203
-
204
-
205
-
206
-
207
-
208
-
209
-
210
-
211
-
212
-
213
-
214
-
215
-
216
-
217
-
218
-
219
-
220
-
221
-
222
-
223
-
224
-
225
-
226
-
227
-
228
-
229
-
230
-
231
-
232
-
233
-
234
-
235
-
236
-
237
-
238
-
239
-
240
-
241
-
242
-
243
-
244
-
245
-
246
-
247
-
248
-
249
-
250
-
251
-
252
-
253
-
254
-
255
-
256
-
257
-
258
-
259
-
260
-
261
-
262
-
263
-
264
-
265
-
266
-
267
-
268
-
269
-
270
-
271
-
272
 |
 |

164 Bank of America 2014
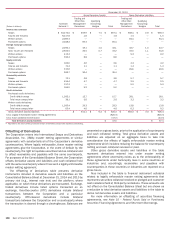
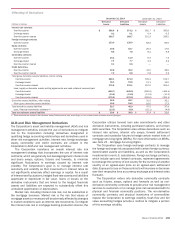
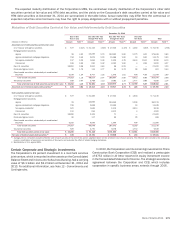
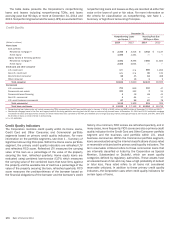
Credit derivative instruments where the Corporation is the
seller of credit protection and their expiration at December 31,
2014 and 2013 are summarized in the table below. These
instruments are classified as investment and non-investment
grade based on the credit quality of the underlying referenced
obligation. The Corporation considers ratings of BBB- or higher as
investment grade. Non-investment grade includes non-rated credit
derivative instruments. The Corporation discloses internal
categorizations of investment grade and non-investment grade
consistent with how risk is managed for these instruments.
Credit Derivative Instruments
December 31, 2014
Carrying Value
(Dollars in millions)
Less than
One Year
One to
Three Years
Three to
Five Years
Over Five
Years Total
Credit default swaps:
Investment grade $100 $714 $ 1,455 $ 939 $ 3,208
Non-investment grade 916 2,107 1,338 4,301 8,662
Total 1,016 2,821 2,793 5,240 11,870
Total return swaps/other:
Investment grade 24 — ——
24
Non-investment grade 64 247 2—313
Total 88 247 2—337
Total credit derivatives $ 1,104 $ 3,068 $ 2,795 $ 5,240 $ 12,207
Credit-related notes:
Investment grade $2$
365 $568 $ 2,634 $ 3,569
Non-investment grade 5141 85 1,443 1,674
Total credit-related notes $ 7 $ 506 $653 $ 4,077 $ 5,243
Maximum Payout/Notional
Credit default swaps:
Investment grade $ 132,974 $ 342,914 $ 242,728 $ 28,982 $ 747,598
Non-investment grade 54,326 170,580 80,011 20,586 325,503
Total 187,300 513,494 322,739 49,568 1,073,101
Total return swaps/other:
Investment grade 22,645 — ——
22,645
Non-investment grade 23,839 10,792 3,268 487 38,386
Total 46,484 10,792 3,268 487 61,031
Total credit derivatives $ 233,784 $ 524,286 $ 326,007 $ 50,055 $ 1,134,132
December 31, 2013
Carrying Value
Credit default swaps:
Investment grade $ 2 $ 220 $ 974 $ 1,134 $ 2,330
Non-investment grade 424 1,924 2,469 6,667 11,484
Total 426 2,144 3,443 7,801 13,814
Total return swaps/other:
Investment grade 22 — — — 22
Non-investment grade 29 38 2 86 155
Total 51 38 2 86 177
Total credit derivatives $ 477 $ 2,182 $ 3,445 $ 7,887 $ 13,991
Credit-related notes:
Investment grade $ — $ 278 $ 595 $ 4,457 $ 5,330
Non-investment grade 145 107 756 946 1,954
Total credit-related notes $ 145 $ 385 $ 1,351 $ 5,403 $ 7,284
Maximum Payout/Notional
Credit default swaps:
Investment grade $170,764 $379,273 $411,426 $ 36,039 $ 997,502
Non-investment grade 53,316 90,986 95,319 28,257 267,878
Total 224,080 470,259 506,745 64,296 1,265,380
Total return swaps/other:
Investment grade 21,771 — — — 21,771
Non-investment grade 27,784 8,150 4,103 1,599 41,636
Total 49,555 8,150 4,103 1,599 63,407
Total credit derivatives $273,635 $478,409 $510,848 $ 65,895 $ 1,328,787