Bank of America 2014 Annual Report Download - page 51
Download and view the complete annual report
Please find page 51 of the 2014 Bank of America annual report below. You can navigate through the pages in the report by either clicking on the pages listed below, or by using the keyword search tool below to find specific information within the annual report.-
 1
1 -
2
-
3
-
4
-
5
-
6
-
7
-
8
-
9
-
10
-
11
-
12
-
13
-
14
-
15
-
16
-
17
-
18
-
19
-
20
-
21
-
22
-
23
-
24
-
25
-
26
-
27
-
28
-
29
-
30
-
31
-
32
-
33
-
34
-
35
-
36
-
37
-
38
-
39
-
40
-
 41
41 -
 42
42 -
 43
43 -
 44
44 -
 45
45 -
 46
46 -
 47
47 -
 48
48 -
 49
49 -
 50
50 -
 51
51 -
 52
52 -
 53
53 -
 54
54 -
 55
55 -
 56
56 -
 57
57 -
 58
58 -
 59
59 -
 60
60 -
 61
61 -
62
-
63
-
64
-
65
-
66
-
67
-
68
-
69
-
70
-
71
-
72
-
73
-
74
-
75
-
76
-
77
-
78
-
79
-
80
-
81
-
82
-
83
-
84
-
85
-
86
-
87
-
88
-
89
-
90
-
91
-
92
-
93
-
94
-
95
-
96
-
97
-
98
-
99
-
100
-
101
-
102
-
103
-
104
-
105
-
106
-
107
-
108
-
109
-
110
-
111
-
112
-
113
-
114
-
115
-
116
-
117
-
118
-
119
-
120
-
121
-
122
-
123
-
124
-
125
-
126
-
127
-
128
-
129
-
130
-
131
-
132
-
133
-
134
-
135
-
136
-
137
-
138
-
139
-
140
-
141
-
142
-
143
-
144
-
145
-
146
-
147
-
148
-
149
-
150
-
151
-
152
-
153
-
154
-
155
-
156
-
157
-
158
-
159
-
160
-
161
-
162
-
163
-
164
-
165
-
166
-
167
-
168
-
169
-
170
-
171
-
172
-
173
-
174
-
175
-
176
-
177
-
178
-
179
-
180
-
181
-
182
-
183
-
184
-
185
-
186
-
187
-
188
-
189
-
190
-
191
-
192
-
193
-
194
-
195
-
196
-
197
-
198
-
199
-
200
-
201
-
202
-
203
-
204
-
205
-
206
-
207
-
208
-
209
-
210
-
211
-
212
-
213
-
214
-
215
-
216
-
217
-
218
-
219
-
220
-
221
-
222
-
223
-
224
-
225
-
226
-
227
-
228
-
229
-
230
-
231
-
232
-
233
-
234
-
235
-
236
-
237
-
238
-
239
-
240
-
241
-
242
-
243
-
244
-
245
-
246
-
247
-
248
-
249
-
250
-
251
-
252
-
253
-
254
-
255
-
256
-
257
-
258
-
259
-
260
-
261
-
262
-
263
-
264
-
265
-
266
-
267
-
268
-
269
-
270
-
271
-
272
 |
 |

Bank of America 2014 49
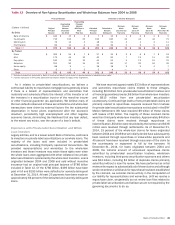
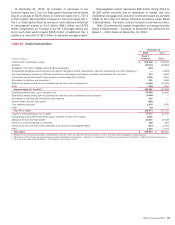
Table 12 Overview of Non-Agency Securitization and Whole-loan Balances from 2004 to 2008
Principal Balance Defaulted or Severely Delinquent
(Dollars in billions)
By Entity
Original
Principal
Balance
Outstanding
Principal
Balance
December
31, 2014
Outstanding
Principal
Balance
180 Days or
More
Past Due
Defaulted
Principal
Balance
Defaulted or
Severely
Delinquent
Borrower
Made
Less than 13
Payments
Borrower
Made
13 to 24
Payments
Borrower
Made
25 to 36
Payments
Borrower
Made
More than 36
Payments
Bank of America $ 100 $ 15 $ 3 $ 7 $ 10 $ 1 $ 2 $ 2 $ 5
Countrywide 716 153 35 150 185 24 44 44 73
Merrill Lynch 72 13 3 18 2134311
First Franklin 82143262956513
Total (1, 2) $ 970 $ 195 $ 44 $ 201 $ 245 $33$56 $54 $ 102
By Product
Prime $ 302$ 55$ 7$ 27$ 34$ 2$ 6$ 7$ 19
Alt-A 173 44 10 40 50 7 12 11 20
Pay option 150 32 10 44 54 5 13 15 21
Subprime 251 50 15 70 85 17 20 16 32
Home equity 88 9 — 18 182547
Other 65224——13
Total $ 970 $ 195 $ 44 $ 201 $ 245 $33$56 $54 $ 102
(1) Excludes transactions sponsored by Bank of America and Merrill Lynch where no representations or warranties were made.
(2) Includes exposures on third-party sponsored transactions related to legacy entity originations.
As it relates to private-label securitizations, we believe a
contractual liability to repurchase mortgage loans generally arises
if there is a breach of representations and warranties that
materially and adversely affects the interest of the investor or all
the investors in a securitization trust or of the monoline insurer
or other financial guarantor (as applicable). We believe many of
the loan defaults observed in these securitizations and whole-loan
transactions were driven by external factors like the substantial
depreciation in home prices experienced after the economic
downturn, persistently high unemployment and other negative
economic trends, diminishing the likelihood that any loan defect,
to the extent any exists, was the cause of a loan’s default.
Experience with Private-label Securitization and Whole
Loan Investors
Legacy entities, and to a lesser extent Bank of America, sold loans
to investors via private-label securitizations or as whole loans. The
majority of the loans sold were included in private-label
securitizations, including third-party sponsored transactions. We
provided representations and warranties to the whole-loan
investors and these investors may retain those rights even when
the whole loans were aggregated with other collateral into private-
label securitizations sponsored by the whole-loan investors. Loans
originated between 2004 and 2008 and sold without monoline
insurance had an original total principal balance of $786 billion
included in Table 12. Of the $786 billion, $469 billion have been
paid in full and $193 billion were defaulted or severely delinquent
at December 31, 2014. At least 25 payments have been made on
approximately 64 percent of the defaulted and severely delinquent
loans.
We have received approximately $33 billion of representations
and warranties repurchase claims related to these vintages,
including $24 billion from private-label securitization trustees and
a financial guarantee provider, $8 billion from whole-loan investors
and $815 million from one private-label securitization
counterparty. Continued high levels of new private-label claims are
primarily related to repurchase requests received from trustees
for private-label securitization transactions not included in the BNY
Mellon Settlement. We have resolved $9 billion of these claims
with losses of $2 billion. The majority of these resolved claims
were from third-party whole-loan investors. Approximately $4 billion
of these claims were resolved through repurchase or
indemnification, $5 billion were rescinded by the investor and $336
million were resolved through settlements. As of December 31,
2014, 15 percent of the whole-loan claims for loans originated
between 2004 and 2008 that we initially denied have subsequently
been resolved through repurchase or make-whole payments and
45 percent have been resolved through rescission of the claim by
the counterparty or repayment in full by the borrower. At
December 31, 2014, for loans originated between 2004 and
2008, the notional amount of unresolved repurchase claims
submitted by private-label securitization trustees, whole-loan
investors, including third-party securitization sponsors and others
was $24 billion, including $3 billion of duplicate claims primarily
submitted without a loan file review. We have performed an initial
review with respect to substantially all of these claims and although
we do not believe a valid basis for repurchase has been established
by the claimant, we consider claims activity in the computation of
our liability for representations and warranties. Until we receive a
repurchase claim, we generally do not review loan files related to
private-label securitizations and believe we are not required by the
governing documents to do so.