Bank of America 2014 Annual Report Download - page 173
Download and view the complete annual report
Please find page 173 of the 2014 Bank of America annual report below. You can navigate through the pages in the report by either clicking on the pages listed below, or by using the keyword search tool below to find specific information within the annual report.-
 1
1 -
2
-
3
-
4
-
5
-
6
-
7
-
8
-
9
-
10
-
11
-
12
-
13
-
14
-
15
-
16
-
17
-
18
-
19
-
20
-
21
-
22
-
23
-
24
-
25
-
26
-
27
-
28
-
29
-
30
-
31
-
32
-
33
-
34
-
35
-
36
-
37
-
38
-
39
-
40
-
41
-
42
-
43
-
44
-
45
-
46
-
47
-
48
-
49
-
50
-
51
-
52
-
53
-
54
-
55
-
56
-
57
-
58
-
59
-
60
-
61
-
62
-
63
-
64
-
65
-
66
-
67
-
68
-
69
-
70
-
71
-
72
-
73
-
74
-
75
-
76
-
77
-
78
-
79
-
80
-
81
-
82
-
83
-
84
-
85
-
86
-
87
-
88
-
89
-
90
-
91
-
92
-
93
-
94
-
95
-
96
-
97
-
98
-
99
-
100
-
101
-
102
-
103
-
104
-
105
-
106
-
107
-
108
-
109
-
110
-
111
-
112
-
113
-
114
-
115
-
116
-
117
-
118
-
119
-
120
-
121
-
122
-
123
-
124
-
125
-
126
-
127
-
128
-
129
-
130
-
131
-
132
-
133
-
134
-
135
-
136
-
137
-
138
-
139
-
140
-
141
-
142
-
143
-
144
-
145
-
146
-
147
-
148
-
149
-
150
-
151
-
152
-
153
-
154
-
155
-
156
-
157
-
158
-
159
-
160
-
161
-
162
-
 163
163 -
 164
164 -
 165
165 -
 166
166 -
 167
167 -
 168
168 -
 169
169 -
 170
170 -
 171
171 -
 172
172 -
 173
173 -
 174
174 -
 175
175 -
 176
176 -
 177
177 -
 178
178 -
 179
179 -
 180
180 -
 181
181 -
 182
182 -
 183
183 -
184
-
185
-
186
-
187
-
188
-
189
-
190
-
191
-
192
-
193
-
194
-
195
-
196
-
197
-
198
-
199
-
200
-
201
-
202
-
203
-
204
-
205
-
206
-
207
-
208
-
209
-
210
-
211
-
212
-
213
-
214
-
215
-
216
-
217
-
218
-
219
-
220
-
221
-
222
-
223
-
224
-
225
-
226
-
227
-
228
-
229
-
230
-
231
-
232
-
233
-
234
-
235
-
236
-
237
-
238
-
239
-
240
-
241
-
242
-
243
-
244
-
245
-
246
-
247
-
248
-
249
-
250
-
251
-
252
-
253
-
254
-
255
-
256
-
257
-
258
-
259
-
260
-
261
-
262
-
263
-
264
-
265
-
266
-
267
-
268
-
269
-
270
-
271
-
272
 |
 |

Bank of America 2014 171
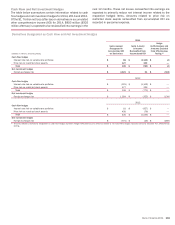
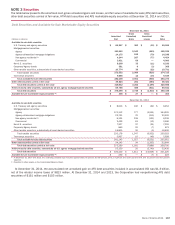
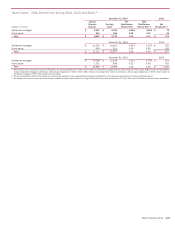
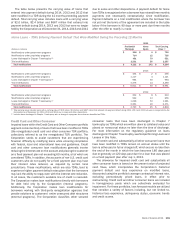
The expected maturity distribution of the Corporation’s MBS, the contractual maturity distribution of the Corporation’s other debt
securities carried at fair value and HTM debt securities, and the yields on the Corporation’s debt securities carried at fair value and
HTM debt securities at December 31, 2014 are summarized in the table below. Actual maturities may differ from the contractual or
expected maturities since borrowers may have the right to prepay obligations with or without prepayment penalties.
Maturities of Debt Securities Carried at Fair Value and Held-to-maturity Debt Securities
December 31, 2014
Due in One
Year or Less
Due after One Year
through Five Years
Due after Five Years
through Ten Years
Due after
Ten Years Total
(Dollars in millions) Amount Yield (1) Amount Yield (1) Amount Yield (1) Amount Yield (1) Amount Yield (1)
Amortized cost of debt securities carried at fair value
U.S. Treasury and agency securities $ 577 0.41% $ 51,153 1.60% $ 17,535 2.10% $ 1,480 3.00% $ 70,745 1.78%
Mortgage-backed securities:
Agency 28 4.60 24,283 2.70 152,950 2.80 2,175 3.00 179,436 2.80
Agency-collateralized mortgage obligations 794 0.40 2,874 2.00 10,488 2.80 19 0.60 14,175 2.50
Non-agency residential 517 5.09 1,834 5.39 1,236 4.78 4,443 10.61 8,030 8.15
Commercial 188 9.69 590 2.32 3,150 2.80 3 2.83 3,931 3.07
Non-U.S. securities 18,991 0.98 2,261 3.83 68 6.23 — — 21,320 1.30
Corporate/Agency bonds 59 1.79 112 3.77 94 3.74 96 0.63 361 2.43
Other taxable securities, substantially all asset-backed
securities 3,199 1.34 5,707 1.22 1,376 1.81 796 4.36 11,078 1.59
Total taxable securities 24,353 1.16 88,814 2.07 186,897 2.80 9,012 6.86 309,076 2.56
Tax-exempt securities 929 0.97 3,768 1.13 3,082 1.15 1,777 0.86 9,556 1.14
Total amortized cost of debt securities carried at fair value $ 25,282 1.16 $ 92,582 2.03 $ 189,979 2.77 $ 10,789 5.87 $ 318,632 2.51
Amortized cost of held-to-maturity debt securities (2) $ 108 0.84 $ 19,513 2.40 $ 39,917 2.30 $ 228 3.31 $ 59,766 2.40
Debt securities carried at fair value
U.S. Treasury and agency securities $ 577 $ 51,383 $ 17,633 $ 1,543 $ 71,136
Mortgage-backed securities:
Agency 29 24,859 153,649 2,206 180,743
Agency-collateralized mortgage obligations 795 2,838 10,596 19 14,248
Non-agency residential 521 1,849 1,316 4,513 8,199
Commercial 191 594 3,212 3 4,000
Non-U.S. securities 18,982 2,309 71 — 21,362
Corporate/Agency bonds 60 117 96 95
368
Other taxable securities, substantially all asset-backed
securities 3,202 5,699 1,399 790
11,090
Total taxable securities 24,357 89,648 187,972 9,169 311,146
Tax-exempt securities 929 3,770 3,078 1,772 9,549
Total debt securities carried at fair value $ 25,286 $ 93,418 $ 191,050 $ 10,941 $ 320,695
Fair value of held-to-maturity debt securities (2) $ 108 $ 19,762 $ 39,538 $ 233 $ 59,641
(1) Average yield is computed using the effective yield of each security at the end of the period, weighted based on the amortized cost of each security. The effective yield considers the contractual
coupon, amortization of premiums and accretion of discounts, and excludes the effect of related hedging derivatives.
(2) Substantially all U.S. agency MBS.
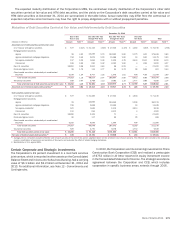
Certain Corporate and Strategic Investments
The Corporation’s 49 percent investment in a merchant services
joint venture, which is recorded in other assets on the Consolidated
Balance Sheet and in Consumer & Business Banking, had a carrying
value of $3.1 billion and $3.2 billion at December 31, 2014 and
2013. For additional information, see Note 12 – Commitments and
Contingencies.
In 2013, the Corporation sold its remaining investment in China
Construction Bank Corporation (CCB) and realized a pretax gain
of $753 million in All Other reported in equity investment income
in the Consolidated Statement of Income. The strategic assistance
agreement between the Corporation and CCB, which includes
cooperation in specific business areas, extends through 2016.