Bank of America 2014 Annual Report Download - page 147
Download and view the complete annual report
Please find page 147 of the 2014 Bank of America annual report below. You can navigate through the pages in the report by either clicking on the pages listed below, or by using the keyword search tool below to find specific information within the annual report.-
 1
1 -
2
-
3
-
4
-
5
-
6
-
7
-
8
-
9
-
10
-
11
-
12
-
13
-
14
-
15
-
16
-
17
-
18
-
19
-
20
-
21
-
22
-
23
-
24
-
25
-
26
-
27
-
28
-
29
-
30
-
31
-
32
-
33
-
34
-
35
-
36
-
37
-
38
-
39
-
40
-
41
-
42
-
43
-
44
-
45
-
46
-
47
-
48
-
49
-
50
-
51
-
52
-
53
-
54
-
55
-
56
-
57
-
58
-
59
-
60
-
61
-
62
-
63
-
64
-
65
-
66
-
67
-
68
-
69
-
70
-
71
-
72
-
73
-
74
-
75
-
76
-
77
-
78
-
79
-
80
-
81
-
82
-
83
-
84
-
85
-
86
-
87
-
88
-
89
-
90
-
91
-
92
-
93
-
94
-
95
-
96
-
97
-
98
-
99
-
100
-
101
-
102
-
103
-
104
-
105
-
106
-
107
-
108
-
109
-
110
-
111
-
112
-
113
-
114
-
115
-
116
-
117
-
118
-
119
-
120
-
121
-
122
-
123
-
124
-
125
-
126
-
127
-
128
-
129
-
130
-
131
-
132
-
133
-
134
-
135
-
136
-
 137
137 -
 138
138 -
 139
139 -
 140
140 -
 141
141 -
 142
142 -
 143
143 -
 144
144 -
 145
145 -
 146
146 -
 147
147 -
 148
148 -
 149
149 -
 150
150 -
 151
151 -
 152
152 -
 153
153 -
 154
154 -
 155
155 -
 156
156 -
 157
157 -
158
-
159
-
160
-
161
-
162
-
163
-
164
-
165
-
166
-
167
-
168
-
169
-
170
-
171
-
172
-
173
-
174
-
175
-
176
-
177
-
178
-
179
-
180
-
181
-
182
-
183
-
184
-
185
-
186
-
187
-
188
-
189
-
190
-
191
-
192
-
193
-
194
-
195
-
196
-
197
-
198
-
199
-
200
-
201
-
202
-
203
-
204
-
205
-
206
-
207
-
208
-
209
-
210
-
211
-
212
-
213
-
214
-
215
-
216
-
217
-
218
-
219
-
220
-
221
-
222
-
223
-
224
-
225
-
226
-
227
-
228
-
229
-
230
-
231
-
232
-
233
-
234
-
235
-
236
-
237
-
238
-
239
-
240
-
241
-
242
-
243
-
244
-
245
-
246
-
247
-
248
-
249
-
250
-
251
-
252
-
253
-
254
-
255
-
256
-
257
-
258
-
259
-
260
-
261
-
262
-
263
-
264
-
265
-
266
-
267
-
268
-
269
-
270
-
271
-
272
 |
 |

Bank of America 2014 145
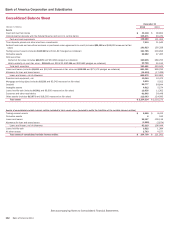
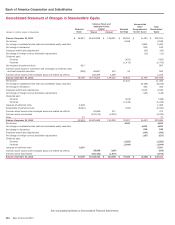
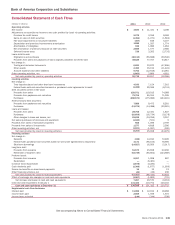
Bank of America Corporation and Subsidiaries
Consolidated Statement of Cash Flows
(Dollars in millions) 2014 2013 2012
Operating activities
Net income $ 4,833 $ 11,431 $ 4,188
Adjustments to reconcile net income to net cash provided by (used in) operating activities:
Provision for credit losses 2,275 3,556 8,169
Gains on sales of debt securities (1,354)(1,271) (1,662)
Fair value adjustments on structured liabilities (407) 649 5,107
Depreciation and premises improvements amortization 1,586 1,597 1,774
Amortization of intangibles 936 1,086 1,264
Net amortization of premium/discount on debt securities 2,688 1,577 2,580
Deferred income taxes 726 3,262 (2,735)
Loans held-for-sale:
Originations and purchases (40,113) (65,688) (59,540)
Proceeds from sales and paydowns of loans originally classified as held-for-sale 38,528 77,707 54,817
Net change in:
Trading and derivative instruments 6,621 33,870 (47,606)
Other assets 2,380 35,154 (11,424)
Accrued expenses and other liabilities 9,702 (12,919) 24,061
Other operating activities, net (1,662)2,806 4,951
Net cash provided by (used in) operating activities 26,739 92,817 (16,056)
Investing activities
Net change in:
Time deposits placed and other short-term investments 4,030 7,154 7,310
Federal funds sold and securities borrowed or purchased under agreements to resell (1,495)29,596 (8,741)
Debt securities carried at fair value:
Proceeds from sales 159,071 119,013 74,068
Proceeds from paydowns and maturities 79,704 85,554 71,509
Purchases (280,571) (175,983) (164,491)
Held-to-maturity debt securities:
Proceeds from paydowns and maturities 7,889 8,472 6,261
Purchases (13,274) (14,388) (20,991)
Loans and leases:
Proceeds from sales 28,765 12,331 1,837
Purchases (10,609) (16,734) (9,178)
Other changes in loans and leases, net 22,635 (34,256) 2,557
Net sales (purchases) of premises and equipment (1,160)(521) 5
Proceeds from sales of foreclosed properties 855 1,099 2,799
Proceeds from sales of investments 1,577 4,818 2,396
Other investing activities, net (1,621)(1,097) (320)
Net cash provided by (used in) investing activities (4,204)25,058 (34,979)
Financing activities
Net change in:
Deposits (335) 14,010 72,220
Federal funds purchased and securities loaned or sold under agreements to repurchase 3,171 (95,153) 78,395
Short-term borrowings (14,827) 16,009 (5,017)
Long-term debt:
Proceeds from issuance 51,573 45,658 22,200
Retirement of long-term debt (53,749) (65,602) (124,389)
Preferred stock:
Proceeds from issuance 5,957 1,008 667
Redemption —(6,461) —
Common stock repurchased (1,675)(3,220) —
Cash dividends paid (2,306)(1,677) (1,909)
Excess tax benefits on share-based payments 34 12 13
Other financing activities, net (44) (26) 236
Net cash provided by (used in) financing activities (12,201) (95,442) 42,416
Effect of exchange rate changes on cash and cash equivalents (3,067)(1,863) (731)
Net increase (decrease) in cash and cash equivalents 7,267 20,570 (9,350)
Cash and cash equivalents at January 1 131,322 110,752 120,102
Cash and cash equivalents at December 31 $ 138,589 $ 131,322 $ 110,752
Supplemental cash flow disclosures
Interest paid $ 11,082 $ 12,912 $ 18,268
Income taxes paid 2,558 1,559 1,372
Income taxes refunded (144) (244) (338)
See accompanying Notes to Consolidated Financial Statements.