Bank of America 2014 Annual Report Download - page 24
Download and view the complete annual report
Please find page 24 of the 2014 Bank of America annual report below. You can navigate through the pages in the report by either clicking on the pages listed below, or by using the keyword search tool below to find specific information within the annual report.-
 1
1 -
2
-
3
-
4
-
5
-
6
-
7
-
8
-
9
-
10
-
11
-
12
-
13
-
 14
14 -
 15
15 -
 16
16 -
 17
17 -
 18
18 -
 19
19 -
 20
20 -
 21
21 -
 22
22 -
 23
23 -
 24
24 -
 25
25 -
 26
26 -
 27
27 -
 28
28 -
 29
29 -
 30
30 -
 31
31 -
 32
32 -
 33
33 -
 34
34 -
35
-
36
-
37
-
38
-
39
-
40
-
41
-
42
-
43
-
44
-
45
-
46
-
47
-
48
-
49
-
50
-
51
-
52
-
53
-
54
-
55
-
56
-
57
-
58
-
59
-
60
-
61
-
62
-
63
-
64
-
65
-
66
-
67
-
68
-
69
-
70
-
71
-
72
-
73
-
74
-
75
-
76
-
77
-
78
-
79
-
80
-
81
-
82
-
83
-
84
-
85
-
86
-
87
-
88
-
89
-
90
-
91
-
92
-
93
-
94
-
95
-
96
-
97
-
98
-
99
-
100
-
101
-
102
-
103
-
104
-
105
-
106
-
107
-
108
-
109
-
110
-
111
-
112
-
113
-
114
-
115
-
116
-
117
-
118
-
119
-
120
-
121
-
122
-
123
-
124
-
125
-
126
-
127
-
128
-
129
-
130
-
131
-
132
-
133
-
134
-
135
-
136
-
137
-
138
-
139
-
140
-
141
-
142
-
143
-
144
-
145
-
146
-
147
-
148
-
149
-
150
-
151
-
152
-
153
-
154
-
155
-
156
-
157
-
158
-
159
-
160
-
161
-
162
-
163
-
164
-
165
-
166
-
167
-
168
-
169
-
170
-
171
-
172
-
173
-
174
-
175
-
176
-
177
-
178
-
179
-
180
-
181
-
182
-
183
-
184
-
185
-
186
-
187
-
188
-
189
-
190
-
191
-
192
-
193
-
194
-
195
-
196
-
197
-
198
-
199
-
200
-
201
-
202
-
203
-
204
-
205
-
206
-
207
-
208
-
209
-
210
-
211
-
212
-
213
-
214
-
215
-
216
-
217
-
218
-
219
-
220
-
221
-
222
-
223
-
224
-
225
-
226
-
227
-
228
-
229
-
230
-
231
-
232
-
233
-
234
-
235
-
236
-
237
-
238
-
239
-
240
-
241
-
242
-
243
-
244
-
245
-
246
-
247
-
248
-
249
-
250
-
251
-
252
-
253
-
254
-
255
-
256
-
257
-
258
-
259
-
260
-
261
-
262
-
263
-
264
-
265
-
266
-
267
-
268
-
269
-
270
-
271
-
272
 |
 |

22 Bank of America 2014
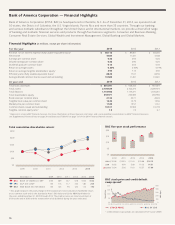
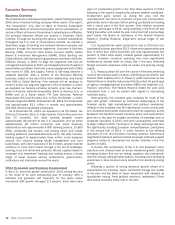
Financial Highlights
Net income was $4.8 billion, or $0.36 per diluted share in 2014
compared to $11.4 billion, or $0.90 per diluted share in 2013.
The results for 2014 included an increase of $10.3 billion in
litigation expense primarily as a result of charges related to the
settlements with the U.S. Department of Justice (DoJ) and the
Federal Housing Finance Agency (FHFA).
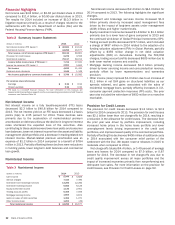
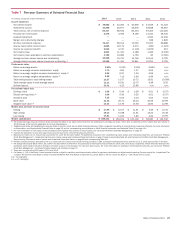
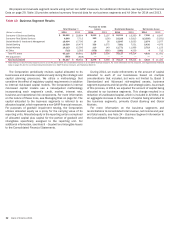
Table 2 Summary Income Statement
(Dollars in millions) 2014 2013
Net interest income (FTE basis) (1) $ 40,821 $ 43,124
Noninterest income 44,295 46,677
Total revenue, net of interest expense (FTE basis) (1) 85,116 89,801
Provision for credit losses 2,275 3,556
Noninterest expense 75,117 69,214
Income before income taxes (FTE basis) (1) 7,724 17,031
Income tax expense (FTE basis) (1) 2,891 5,600
Net income 4,833 11,431
Preferred stock dividends 1,044 1,349
Net income applicable to common shareholders $ 3,789 $ 10,082
Per common share information
Earnings $0.36
$0.94
Diluted earnings 0.36 0.90
(1) FTE basis is a non-GAAP financial measure. For more information on this measure, see
Supplemental Financial Data on page 29, and for a corresponding reconciliation to GAAP financial
measures, see Statistical Table XV.
Net Interest Income
Net interest income on a fully taxable-equivalent (FTE) basis
decreased $2.3 billion to $40.8 billion for 2014 compared to
2013. The net interest yield on an FTE basis decreased 12 basis
points (bps) to 2.25 percent for 2014. These declines were
primarily due to the acceleration of market-related premium
amortization on debt securities as the decline in long-term interest
rates shortened the expected lives of the securities. Also
contributing to these declines were lower loan yields and consumer
loan balances, lower net interest income from the asset and liability
management (ALM) portfolio and a decrease in trading-related net
interest income. Market-related premium amortization was an
expense of $1.2 billion in 2014 compared to a benefit of $784
million in 2013. Partially offsetting these declines were reductions
in funding yields, lower long-term debt balances and commercial
loan growth.
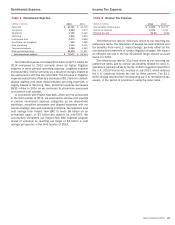
Noninterest Income
Table 3 Noninterest Income
(Dollars in millions) 2014 2013
Card income $ 5,944 $ 5,826
Service charges 7,443 7,390
Investment and brokerage services 13,284 12,282
Investment banking income 6,065 6,126
Equity investment income 1,130 2,901
Trading account profits 6,309 7,056
Mortgage banking income 1,563 3,874
Gains on sales of debt securities 1,354 1,271
Other income (loss) 1,203 (49)
Total noninterest income $ 44,295 $ 46,677
Noninterest income decreased $2.4 billion to $44.3 billion for
2014 compared to 2013. The following highlights the significant
changes.
Investment and brokerage services income increased $1.0
billion primarily driven by increased asset management fees
driven by the impact of long-term assets under management
(AUM) inflows and higher market levels.
Equity investment income decreased $1.8 billion to $1.1 billion
primarily due to a lower level of gains compared to 2013 and
the continued wind-down of Global Principal Investments (GPI).
Trading account profits decreased $747 million, which included
a charge of $497 million in 2014 related to the adoption of a
funding valuation adjustment (FVA) in Global Markets, partially
offset by a $359 million change in net debit valuation
adjustments (DVA) on derivatives. Excluding the FVA/DVA
charges, trading account profits decreased $609 million due to
both lower market volumes and volatility.
Mortgage banking income decreased $2.3 billion primarily
driven by lower servicing income and core production revenue,
partially offset by lower representations and warranties
provision.
Other income (loss) improved $1.3 billion due to an increase of
$1.1 billion in net DVA gains on structured liabilities as our
spreads widened, and gains associated with the sales of
residential mortgage loans, partially offset by increases in U.K.
consumer payment protection insurance (PPI) costs. The prior
year also included the write-down of $450 million on a monoline
receivable.
Provision for Credit Losses
The provision for credit losses decreased $1.3 billion to $2.3
billion for 2014 compared to 2013. The provision for credit losses
was $2.1 billion lower than net charge-offs for 2014, resulting in
a reduction in the allowance for credit losses. The decrease from
the prior year was driven by portfolio improvement, including
increased home prices in the home loans portfolio and lower
unemployment levels driving improvement in the credit card
portfolios, and improved asset quality in the commercial portfolio.
Partially offsetting this decline was $400 million of additional costs
in 2014 associated with the consumer relief portion of the
settlement with the DoJ. We expect reserve releases in 2015 to
moderate when compared to 2014.
Net charge-offs totaled $4.4 billion, or 0.49 percent of average
loans and leases for 2014 compared to $7.9 billion, or 0.87
percent for 2013. The decrease in net charge-offs was due to
credit quality improvement across all major portfolios and the
impact of increased recoveries primarily from nonperforming and
delinquent loan sales. For more information on the provision for
credit losses, see Provision for Credit Losses on page 92.