Bank of America 2014 Annual Report Download - page 28
Download and view the complete annual report
Please find page 28 of the 2014 Bank of America annual report below. You can navigate through the pages in the report by either clicking on the pages listed below, or by using the keyword search tool below to find specific information within the annual report.-
 1
1 -
2
-
3
-
4
-
5
-
6
-
7
-
8
-
9
-
10
-
11
-
12
-
13
-
14
-
15
-
16
-
17
-
 18
18 -
 19
19 -
 20
20 -
 21
21 -
 22
22 -
 23
23 -
 24
24 -
 25
25 -
 26
26 -
 27
27 -
 28
28 -
 29
29 -
 30
30 -
 31
31 -
 32
32 -
 33
33 -
 34
34 -
 35
35 -
 36
36 -
 37
37 -
 38
38 -
39
-
40
-
41
-
42
-
43
-
44
-
45
-
46
-
47
-
48
-
49
-
50
-
51
-
52
-
53
-
54
-
55
-
56
-
57
-
58
-
59
-
60
-
61
-
62
-
63
-
64
-
65
-
66
-
67
-
68
-
69
-
70
-
71
-
72
-
73
-
74
-
75
-
76
-
77
-
78
-
79
-
80
-
81
-
82
-
83
-
84
-
85
-
86
-
87
-
88
-
89
-
90
-
91
-
92
-
93
-
94
-
95
-
96
-
97
-
98
-
99
-
100
-
101
-
102
-
103
-
104
-
105
-
106
-
107
-
108
-
109
-
110
-
111
-
112
-
113
-
114
-
115
-
116
-
117
-
118
-
119
-
120
-
121
-
122
-
123
-
124
-
125
-
126
-
127
-
128
-
129
-
130
-
131
-
132
-
133
-
134
-
135
-
136
-
137
-
138
-
139
-
140
-
141
-
142
-
143
-
144
-
145
-
146
-
147
-
148
-
149
-
150
-
151
-
152
-
153
-
154
-
155
-
156
-
157
-
158
-
159
-
160
-
161
-
162
-
163
-
164
-
165
-
166
-
167
-
168
-
169
-
170
-
171
-
172
-
173
-
174
-
175
-
176
-
177
-
178
-
179
-
180
-
181
-
182
-
183
-
184
-
185
-
186
-
187
-
188
-
189
-
190
-
191
-
192
-
193
-
194
-
195
-
196
-
197
-
198
-
199
-
200
-
201
-
202
-
203
-
204
-
205
-
206
-
207
-
208
-
209
-
210
-
211
-
212
-
213
-
214
-
215
-
216
-
217
-
218
-
219
-
220
-
221
-
222
-
223
-
224
-
225
-
226
-
227
-
228
-
229
-
230
-
231
-
232
-
233
-
234
-
235
-
236
-
237
-
238
-
239
-
240
-
241
-
242
-
243
-
244
-
245
-
246
-
247
-
248
-
249
-
250
-
251
-
252
-
253
-
254
-
255
-
256
-
257
-
258
-
259
-
260
-
261
-
262
-
263
-
264
-
265
-
266
-
267
-
268
-
269
-
270
-
271
-
272
 |
 |
26 Bank of America 2014
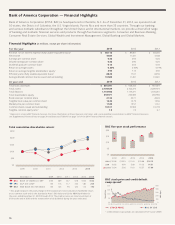
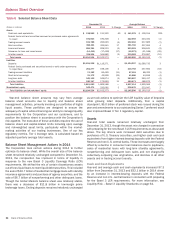
Shareholders’ Equity
Year-end shareholders’ equity increased $10.8 billion driven by
issuances of preferred stock, an increase in accumulated other
comprehensive income (OCI) due to a positive net change in the
fair value of AFS debt securities, and earnings, partially offset by
common stock repurchases and dividends. Average shareholders’
equity increased $4.5 billion driven by earnings and accumulated
OCI, partially offset by common stock repurchases and dividends.
Cash Flows Overview
The Corporation’s operating assets and liabilities support our
global markets and lending activities. We believe that cash flows
from operations, available cash balances and our ability to
generate cash through short- and long-term debt are sufficient to
fund our operating liquidity needs. Our investing activities primarily
include the debt securities portfolio and other short-term
investments. Our financing activities reflect cash flows primarily
related to increased customer deposits and net long-term debt
reductions.
Cash and cash equivalents increased $7.3 billion during 2014
due to net cash provided by operating activities, partially offset by
net cash used in financing and investing activities. This reflects
actions taken in preparation for the Basel 3 LCR requirements.
These changes were primarily due to higher interest-bearing
deposits with the Federal Reserve and non-U.S. central banks as
well as the sale of residential mortgage loans with standby
insurance agreements and the purchase of agency securities, and
the sale of nonperforming and other delinquent loans to further
optimize the balance sheet. Cash and cash equivalents increased
$20.6 billion during 2013 due to net cash provided by operating
and investing activities, partially offset by net cash used in
financing activities.
During 2014, net cash provided by operating activities was
$26.7 billion. The more significant drivers included net decreases
in trading and derivative instruments, as well as a net increase in
accrued expenses and other liabilities. During 2013, net cash
provided by operating activities was $92.8 billion. The more
significant drivers included net decreases in other assets, and
trading and derivative instruments, as well as net proceeds from
sales, securitizations and paydowns of LHFS.
During 2014, net cash used in investing activities was $4.2
billion, primarily driven by net purchases of debt securities, partially
offset by net decreases in loans and leases. During 2013, net
cash provided by investing activities was $25.1 billion, primarily
driven by a decrease in federal funds sold and securities borrowed
or purchased under agreements to resell and net sales of debt
securities, partially offset by a net increase in loans and leases.
During 2014, net cash used in financing activities of $12.2
billion primarily reflected a reduction in short-term borrowings,
partially offset by the issuance of preferred stock. During 2013,
the net cash used in financing activities of $95.4 billion primarily
reflected a decrease in federal funds purchased and securities
loaned or sold under agreements to repurchase and net reductions
in long-term debt, partially offset by growth in short-term
borrowings and deposits.