Bank of America 2014 Annual Report Download - page 35
Download and view the complete annual report
Please find page 35 of the 2014 Bank of America annual report below. You can navigate through the pages in the report by either clicking on the pages listed below, or by using the keyword search tool below to find specific information within the annual report.-
 1
1 -
2
-
3
-
4
-
5
-
6
-
7
-
8
-
9
-
10
-
11
-
12
-
13
-
14
-
15
-
16
-
17
-
18
-
19
-
20
-
21
-
22
-
23
-
24
-
 25
25 -
 26
26 -
 27
27 -
 28
28 -
 29
29 -
 30
30 -
 31
31 -
 32
32 -
 33
33 -
 34
34 -
 35
35 -
 36
36 -
 37
37 -
 38
38 -
 39
39 -
 40
40 -
 41
41 -
 42
42 -
 43
43 -
 44
44 -
 45
45 -
46
-
47
-
48
-
49
-
50
-
51
-
52
-
53
-
54
-
55
-
56
-
57
-
58
-
59
-
60
-
61
-
62
-
63
-
64
-
65
-
66
-
67
-
68
-
69
-
70
-
71
-
72
-
73
-
74
-
75
-
76
-
77
-
78
-
79
-
80
-
81
-
82
-
83
-
84
-
85
-
86
-
87
-
88
-
89
-
90
-
91
-
92
-
93
-
94
-
95
-
96
-
97
-
98
-
99
-
100
-
101
-
102
-
103
-
104
-
105
-
106
-
107
-
108
-
109
-
110
-
111
-
112
-
113
-
114
-
115
-
116
-
117
-
118
-
119
-
120
-
121
-
122
-
123
-
124
-
125
-
126
-
127
-
128
-
129
-
130
-
131
-
132
-
133
-
134
-
135
-
136
-
137
-
138
-
139
-
140
-
141
-
142
-
143
-
144
-
145
-
146
-
147
-
148
-
149
-
150
-
151
-
152
-
153
-
154
-
155
-
156
-
157
-
158
-
159
-
160
-
161
-
162
-
163
-
164
-
165
-
166
-
167
-
168
-
169
-
170
-
171
-
172
-
173
-
174
-
175
-
176
-
177
-
178
-
179
-
180
-
181
-
182
-
183
-
184
-
185
-
186
-
187
-
188
-
189
-
190
-
191
-
192
-
193
-
194
-
195
-
196
-
197
-
198
-
199
-
200
-
201
-
202
-
203
-
204
-
205
-
206
-
207
-
208
-
209
-
210
-
211
-
212
-
213
-
214
-
215
-
216
-
217
-
218
-
219
-
220
-
221
-
222
-
223
-
224
-
225
-
226
-
227
-
228
-
229
-
230
-
231
-
232
-
233
-
234
-
235
-
236
-
237
-
238
-
239
-
240
-
241
-
242
-
243
-
244
-
245
-
246
-
247
-
248
-
249
-
250
-
251
-
252
-
253
-
254
-
255
-
256
-
257
-
258
-
259
-
260
-
261
-
262
-
263
-
264
-
265
-
266
-
267
-
268
-
269
-
270
-
271
-
272
 |
 |

Bank of America 2014 33
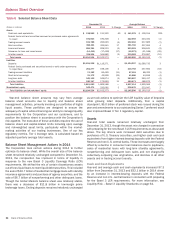
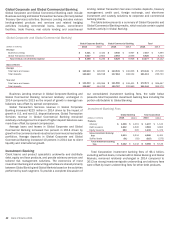
Consumer & Business Banking
Deposits
Consumer
Lending
Total Consumer &
Business Banking
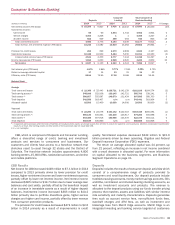
(Dollars in millions) 2014 2013 2014 2013 2014 2013 % Change
Net interest income (FTE basis) $ 10,259 $ 9,807 $ 9,426 $ 10,243 $19,685 $ 20,050 (2)%
Noninterest income:
Card income 68 60 4,834 4,744 4,902 4,804 2
Service charges 4,364 4,206 114,365 4,207 4
All other income 552 509 358 294 910 803 13
Total noninterest income 4,984 4,775 5,193 5,039 10,177 9,814 4
Total revenue, net of interest expense (FTE basis) 15,243 14,582 14,619 15,282 29,862 29,864 —
Provision for credit losses 254 299 2,379 2,808 2,633 3,107 (15)
Noninterest expense 10,448 10,930 5,463 5,330 15,911 16,260 (2)
Income before income taxes (FTE basis) 4,541 3,353 6,777 7,144 11,318 10,497 8
Income tax expense (FTE basis) 1,694 1,230 2,528 2,620 4,222 3,850 10
Net income $ 2,847 $ 2,123 $ 4,249 $ 4,524 $ 7,096 $ 6,647 7
Net interest yield (FTE basis) 1.87% 1.88% 6.77%7.18% 3.48%3.72%
Return on average allocated capital 17 14 33 31 24 22
Efficiency ratio (FTE basis) 68.54 74.95 37.38 34.88 53.28 54.44
Balance Sheet
Average
Total loans and leases $ 22,388 $ 22,445 $ 138,721 $142,129 $ 161,109 $164,574 (2)
Total earning assets (1) 548,096 522,938 139,145 142,721 565,700 539,241 5
Total assets (1) 580,857 555,687 148,579 151,434 607,895 580,703 5
Total deposits 542,589 518,407 n/m n/m 543,441 518,904 5
Allocated capital 16,500 15,400 13,000 14,600 29,500 30,000 (2)
Year end
Total loans and leases $ 22,284 $ 22,578 $ 141,132 $142,516 $ 163,416 $165,094 (1)
Total earning assets (1) 560,130 535,061 141,216 143,917 579,283 550,698 5
Total assets (1) 593,485 567,918 150,956 153,376 622,378 593,014 5
Total deposits 555,539 530,860 n/m n/m 556,568 531,608 5
(1) In segments and businesses where the total of liabilities and equity exceeds assets, we allocate assets from All Other to match the segments’ and businesses’ liabilities and allocated shareholders’
equity. As a result, total earning assets and total assets of the businesses may not equal total CBB.
n/m = not meaningful
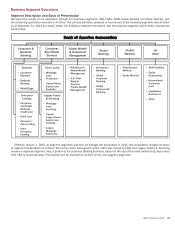
CBB, which is comprised of Deposits and Consumer Lending,
offers a diversified range of credit, banking and investment
products and services to consumers and businesses. Our
customers and clients have access to a franchise network that
stretches coast to coast through 32 states and the District of
Columbia. The franchise network includes approximately 4,800
banking centers, 15,800 ATMs, nationwide call centers, and online
and mobile platforms.
CBB Results
Net income for CBB increased $449 million to $7.1 billion in 2014
compared to 2013 primarily driven by lower provision for credit
losses, higher noninterest income and lower noninterest expense,
partially offset by lower net interest income. Net interest income
decreased $365 million to $19.7 billion due to lower average loan
balances and card yields, partially offset by the beneficial impact
of an increase in investable assets as a result of higher deposit
balances. Noninterest income increased $363 million to $10.2
billion primarily due to portfolio divestiture gains, higher service
charges and higher card income, partially offset by lower revenue
from consumer protection products.
The provision for credit losses decreased $474 million to $2.6
billion in 2014 primarily as a result of improvements in credit
quality. Noninterest expense decreased $349 million to $15.9
billion primarily driven by lower operating, litigation and Federal
Deposit Insurance Corporation (FDIC) expenses.
The return on average allocated capital was 24 percent, up
from 22 percent, reflecting an increase in net income combined
with a small decrease in allocated capital. For more information
on capital allocated to the business segments, see Business
Segment Operations on page 31.
Deposits
Deposits includes the results of consumer deposit activities which
consist of a comprehensive range of products provided to
consumers and small businesses. Our deposit products include
traditional savings accounts, money market savings accounts, CDs
and IRAs, noninterest- and interest-bearing checking accounts, as
well as investment accounts and products. The revenue is
allocated to the deposit products using our funds transfer pricing
process that matches assets and liabilities with similar interest
rate sensitivity and maturity characteristics. Deposits generates
fees such as account service fees, non-sufficient funds fees,
overdraft charges and ATM fees, as well as investment and
brokerage fees from Merrill Edge accounts. Merrill Edge is an
integrated investing and banking service targeted at customers