Bank of America 2014 Annual Report Download - page 32
Download and view the complete annual report
Please find page 32 of the 2014 Bank of America annual report below. You can navigate through the pages in the report by either clicking on the pages listed below, or by using the keyword search tool below to find specific information within the annual report.-
 1
1 -
2
-
3
-
4
-
5
-
6
-
7
-
8
-
9
-
10
-
11
-
12
-
13
-
14
-
15
-
16
-
17
-
18
-
19
-
20
-
21
-
 22
22 -
 23
23 -
 24
24 -
 25
25 -
 26
26 -
 27
27 -
 28
28 -
 29
29 -
 30
30 -
 31
31 -
 32
32 -
 33
33 -
 34
34 -
 35
35 -
 36
36 -
 37
37 -
 38
38 -
 39
39 -
 40
40 -
 41
41 -
 42
42 -
43
-
44
-
45
-
46
-
47
-
48
-
49
-
50
-
51
-
52
-
53
-
54
-
55
-
56
-
57
-
58
-
59
-
60
-
61
-
62
-
63
-
64
-
65
-
66
-
67
-
68
-
69
-
70
-
71
-
72
-
73
-
74
-
75
-
76
-
77
-
78
-
79
-
80
-
81
-
82
-
83
-
84
-
85
-
86
-
87
-
88
-
89
-
90
-
91
-
92
-
93
-
94
-
95
-
96
-
97
-
98
-
99
-
100
-
101
-
102
-
103
-
104
-
105
-
106
-
107
-
108
-
109
-
110
-
111
-
112
-
113
-
114
-
115
-
116
-
117
-
118
-
119
-
120
-
121
-
122
-
123
-
124
-
125
-
126
-
127
-
128
-
129
-
130
-
131
-
132
-
133
-
134
-
135
-
136
-
137
-
138
-
139
-
140
-
141
-
142
-
143
-
144
-
145
-
146
-
147
-
148
-
149
-
150
-
151
-
152
-
153
-
154
-
155
-
156
-
157
-
158
-
159
-
160
-
161
-
162
-
163
-
164
-
165
-
166
-
167
-
168
-
169
-
170
-
171
-
172
-
173
-
174
-
175
-
176
-
177
-
178
-
179
-
180
-
181
-
182
-
183
-
184
-
185
-
186
-
187
-
188
-
189
-
190
-
191
-
192
-
193
-
194
-
195
-
196
-
197
-
198
-
199
-
200
-
201
-
202
-
203
-
204
-
205
-
206
-
207
-
208
-
209
-
210
-
211
-
212
-
213
-
214
-
215
-
216
-
217
-
218
-
219
-
220
-
221
-
222
-
223
-
224
-
225
-
226
-
227
-
228
-
229
-
230
-
231
-
232
-
233
-
234
-
235
-
236
-
237
-
238
-
239
-
240
-
241
-
242
-
243
-
244
-
245
-
246
-
247
-
248
-
249
-
250
-
251
-
252
-
253
-
254
-
255
-
256
-
257
-
258
-
259
-
260
-
261
-
262
-
263
-
264
-
265
-
266
-
267
-
268
-
269
-
270
-
271
-
272
 |
 |

30 Bank of America 2014
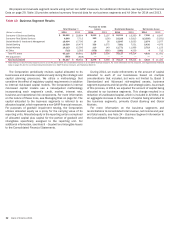
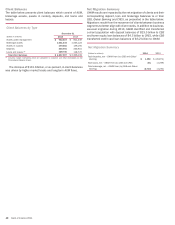
Net Interest Income Excluding Trading-related Net
Interest Income
We manage net interest income on an FTE basis and excluding
the impact of trading-related activities. As discussed in Global
Markets on page 43, we evaluate our sales and trading results
and strategies on a total market-based revenue approach by
combining net interest income and noninterest income for Global
Markets. An analysis of net interest income, average earning
assets and net interest yield on earning assets, all of which adjust
for the impact of trading-related net interest income from reported
net interest income on an FTE basis, is shown below. We believe
the use of this non-GAAP presentation in Table 9 provides
additional clarity in assessing our results.
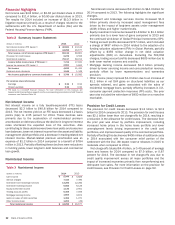
Table 9 Net Interest Income Excluding Trading-related
Net Interest Income
(Dollars in millions) 2014 2013
Net interest income (FTE basis)
As reported $ 40,821 $ 43,124
Impact of trading-related net interest income (3,615) (3,852)
Net interest income excluding trading-related
net interest income (1) $ 37,206 $ 39,272
Average earning assets (2)
As reported $ 1,814,930 $1,819,548
Impact of trading-related earning assets (445,760) (468,999)
Average earning assets excluding trading-
related earning assets (1) $ 1,369,170 $1,350,549
Net interest yield contribution (FTE basis) (2)
As reported 2.25% 2.37%
Impact of trading-related activities 0.47 0.54
Net interest yield on earning assets excluding
trading-related activities (1) 2.72% 2.91%
(1) Represents a non-GAAP financial measure.
(2) Beginning in 2014, interest-bearing deposits placed with the Federal Reserve and certain non-
U.S. central banks are included in earning assets. In prior periods, these balances were included
with cash and due from banks in the cash and cash equivalents line, consistent with the
Consolidated Balance Sheet presentation. Prior periods have been reclassified to conform to
current period presentation.
Net interest income excluding trading-related net interest
income decreased $2.1 billion to $37.2 billion for 2014 compared
to 2013. The decline was primarily due to the impact of market-
related premium amortization as lower long-term interest rates
shortened the expected lives of the securities, lower loan yields
and consumer loan balances, and lower net interest income from
the ALM portfolio. Market-related premium amortization was an
expense of $1.2 billion in 2014 compared to a benefit of $784
million in 2013. Partially offsetting the decline were reductions in
funding yields, lower long-term debt balances and commercial loan
growth. For more information on the impact of interest rates, see
Interest Rate Risk Management for Non-trading Activities on page
102. For more information on market-related premium
amortization, see Note 1 – Summary of Significant Accounting
Principles to the Consolidated Financial Statements.
Average earning assets excluding trading-related earning
assets increased $18.6 billion to $1,369.2 billion for 2014
compared to 2013. The increase was primarily in interest-bearing
deposits with the Federal Reserve and commercial loans, partially
offset by declines in consumer loans and other earning assets.
Net interest yield on earning assets excluding trading-related
activities decreased 19 bps to 2.72 percent for 2014 compared
to 2013 due to the same factors as described above.