Bank of America 2014 Annual Report Download - page 185
Download and view the complete annual report
Please find page 185 of the 2014 Bank of America annual report below. You can navigate through the pages in the report by either clicking on the pages listed below, or by using the keyword search tool below to find specific information within the annual report.-
 1
1 -
2
-
3
-
4
-
5
-
6
-
7
-
8
-
9
-
10
-
11
-
12
-
13
-
14
-
15
-
16
-
17
-
18
-
19
-
20
-
21
-
22
-
23
-
24
-
25
-
26
-
27
-
28
-
29
-
30
-
31
-
32
-
33
-
34
-
35
-
36
-
37
-
38
-
39
-
40
-
41
-
42
-
43
-
44
-
45
-
46
-
47
-
48
-
49
-
50
-
51
-
52
-
53
-
54
-
55
-
56
-
57
-
58
-
59
-
60
-
61
-
62
-
63
-
64
-
65
-
66
-
67
-
68
-
69
-
70
-
71
-
72
-
73
-
74
-
75
-
76
-
77
-
78
-
79
-
80
-
81
-
82
-
83
-
84
-
85
-
86
-
87
-
88
-
89
-
90
-
91
-
92
-
93
-
94
-
95
-
96
-
97
-
98
-
99
-
100
-
101
-
102
-
103
-
104
-
105
-
106
-
107
-
108
-
109
-
110
-
111
-
112
-
113
-
114
-
115
-
116
-
117
-
118
-
119
-
120
-
121
-
122
-
123
-
124
-
125
-
126
-
127
-
128
-
129
-
130
-
131
-
132
-
133
-
134
-
135
-
136
-
137
-
138
-
139
-
140
-
141
-
142
-
143
-
144
-
145
-
146
-
147
-
148
-
149
-
150
-
151
-
152
-
153
-
154
-
155
-
156
-
157
-
158
-
159
-
160
-
161
-
162
-
163
-
164
-
165
-
166
-
167
-
168
-
169
-
170
-
171
-
172
-
173
-
174
-
 175
175 -
 176
176 -
 177
177 -
 178
178 -
 179
179 -
 180
180 -
 181
181 -
 182
182 -
 183
183 -
 184
184 -
 185
185 -
 186
186 -
 187
187 -
 188
188 -
 189
189 -
 190
190 -
 191
191 -
 192
192 -
 193
193 -
 194
194 -
 195
195 -
196
-
197
-
198
-
199
-
200
-
201
-
202
-
203
-
204
-
205
-
206
-
207
-
208
-
209
-
210
-
211
-
212
-
213
-
214
-
215
-
216
-
217
-
218
-
219
-
220
-
221
-
222
-
223
-
224
-
225
-
226
-
227
-
228
-
229
-
230
-
231
-
232
-
233
-
234
-
235
-
236
-
237
-
238
-
239
-
240
-
241
-
242
-
243
-
244
-
245
-
246
-
247
-
248
-
249
-
250
-
251
-
252
-
253
-
254
-
255
-
256
-
257
-
258
-
259
-
260
-
261
-
262
-
263
-
264
-
265
-
266
-
267
-
268
-
269
-
270
-
271
-
272
 |
 |

Bank of America 2014 183
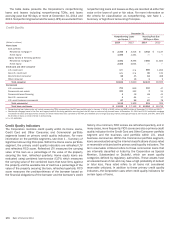
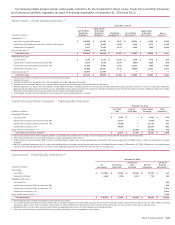
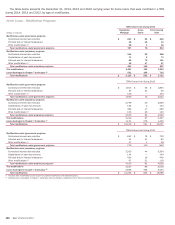
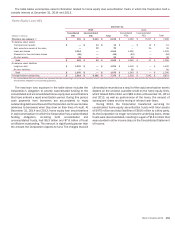
The table below provides information on the Corporation’s renegotiated TDR portfolio including the December 31, 2014, 2013 and
2012 unpaid principal balance, carrying value and average pre- and post-modification interest rates of loans that were modified in TDRs
during 2014, 2013 and 2012, and net charge-offs recorded during the period in which the modification occurred.
Credit Card and Other Consumer – Renegotiated TDRs Entered into During 2014, 2013 and 2012
December 31, 2014 2014
(Dollars in millions)
Unpaid
Principal
Balance
Carrying
Value (1)
Pre-
Modification
Interest Rate
Post-
Modification
Interest Rate
Net
Charge-offs
U.S. credit card $276 $301 16.64% 5.15%$ 37
Non-U.S. credit card 91 106 24.90 0.68 91
Direct/Indirect consumer 27 19 8.66 4.90 14
Total $394 $426 18.32 4.03 $ 142
December 31, 2013 2013
U.S. credit card $ 299 $ 329 16.84% 5.84% $ 30
Non-U.S. credit card 134 147 25.90 0.95 138
Direct/Indirect consumer 47 38 11.53 4.74 15
Other consumer 8 8 9.28 5.25 —
Total $ 488 $ 522 18.89 4.37 $ 183
December 31, 2012 2012
U.S. credit card $ 396 $ 400 17.59% 6.36% $ 45
Non-U.S. credit card 196 206 26.19 1.15 190
Direct/Indirect consumer 160 113 9.59 5.72 52
Other consumer 9 9 9.97 6.44 —
Total $ 761 $ 728 18.68 4.79 $ 287
(1) Includes accrued interest and fees.
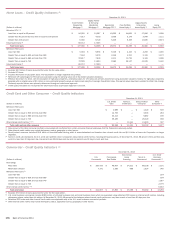
The table below provides information on the Corporation’s primary modification programs for the renegotiated TDR portfolio for
loans that were modified in TDRs during 2014, 2013 and 2012.
Credit Card and Other Consumer – Renegotiated TDRs Entered into During the Period by Program Type
2014
(Dollars in millions)
Internal
Programs
External
Programs Other (1) Total
U.S. credit card $196 $105 $—$ 301
Non-U.S. credit card 66
94 106
Direct/Indirect consumer 42
13 19
Total renegotiated TDRs $ 206 $113 $107 $ 426
2013
U.S. credit card $ 192 $ 137 $ — $ 329
Non-U.S. credit card 16 9 122 147
Direct/Indirect consumer 15 81538
Other consumer 8—— 8
Total renegotiated TDRs $ 231 $ 154 $ 137 $ 522
2012
U.S. credit card $ 248 $ 152 $ — $ 400
Non-U.S. credit card 38 14 154 206
Direct/Indirect consumer 36 19 58 113
Other consumer 9—— 9
Total renegotiated TDRs $ 331 $ 185 $ 212 $ 728
(1) Other TDRs for non-U.S. credit card include modifications of accounts that are ineligible for a fixed payment plan.