Bank of America 2014 Annual Report Download - page 124
Download and view the complete annual report
Please find page 124 of the 2014 Bank of America annual report below. You can navigate through the pages in the report by either clicking on the pages listed below, or by using the keyword search tool below to find specific information within the annual report.-
 1
1 -
2
-
3
-
4
-
5
-
6
-
7
-
8
-
9
-
10
-
11
-
12
-
13
-
14
-
15
-
16
-
17
-
18
-
19
-
20
-
21
-
22
-
23
-
24
-
25
-
26
-
27
-
28
-
29
-
30
-
31
-
32
-
33
-
34
-
35
-
36
-
37
-
38
-
39
-
40
-
41
-
42
-
43
-
44
-
45
-
46
-
47
-
48
-
49
-
50
-
51
-
52
-
53
-
54
-
55
-
56
-
57
-
58
-
59
-
60
-
61
-
62
-
63
-
64
-
65
-
66
-
67
-
68
-
69
-
70
-
71
-
72
-
73
-
74
-
75
-
76
-
77
-
78
-
79
-
80
-
81
-
82
-
83
-
84
-
85
-
86
-
87
-
88
-
89
-
90
-
91
-
92
-
93
-
94
-
95
-
96
-
97
-
98
-
99
-
100
-
101
-
102
-
103
-
104
-
105
-
106
-
107
-
108
-
109
-
110
-
111
-
112
-
113
-
 114
114 -
 115
115 -
 116
116 -
 117
117 -
 118
118 -
 119
119 -
 120
120 -
 121
121 -
 122
122 -
 123
123 -
 124
124 -
 125
125 -
 126
126 -
 127
127 -
 128
128 -
 129
129 -
 130
130 -
 131
131 -
 132
132 -
 133
133 -
 134
134 -
135
-
136
-
137
-
138
-
139
-
140
-
141
-
142
-
143
-
144
-
145
-
146
-
147
-
148
-
149
-
150
-
151
-
152
-
153
-
154
-
155
-
156
-
157
-
158
-
159
-
160
-
161
-
162
-
163
-
164
-
165
-
166
-
167
-
168
-
169
-
170
-
171
-
172
-
173
-
174
-
175
-
176
-
177
-
178
-
179
-
180
-
181
-
182
-
183
-
184
-
185
-
186
-
187
-
188
-
189
-
190
-
191
-
192
-
193
-
194
-
195
-
196
-
197
-
198
-
199
-
200
-
201
-
202
-
203
-
204
-
205
-
206
-
207
-
208
-
209
-
210
-
211
-
212
-
213
-
214
-
215
-
216
-
217
-
218
-
219
-
220
-
221
-
222
-
223
-
224
-
225
-
226
-
227
-
228
-
229
-
230
-
231
-
232
-
233
-
234
-
235
-
236
-
237
-
238
-
239
-
240
-
241
-
242
-
243
-
244
-
245
-
246
-
247
-
248
-
249
-
250
-
251
-
252
-
253
-
254
-
255
-
256
-
257
-
258
-
259
-
260
-
261
-
262
-
263
-
264
-
265
-
266
-
267
-
268
-
269
-
270
-
271
-
272
 |
 |

122 Bank of America 2014
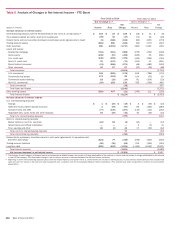
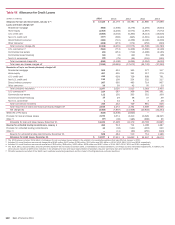
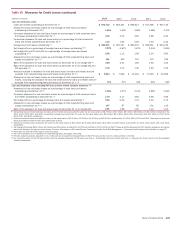
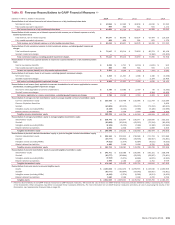
Table VII Allowance for Credit Losses
(Dollars in millions) 2014 2013 2012 2011 2010
Allowance for loan and lease losses, January 1 (1) $ 17,428 $ 24,179 $ 33,783 $ 41,885 $ 47,988
Loans and leases charged off
Residential mortgage (855) (1,508) (3,276) (4,294) (3,843)
Home equity (1,364)(2,258) (4,573) (4,997) (7,072)
U.S. credit card (3,068)(4,004) (5,360) (8,114) (13,818)
Non-U.S. credit card (357) (508) (835) (1,691) (2,424)
Direct/Indirect consumer (456) (710) (1,258) (2,190) (4,303)
Other consumer (268) (273) (274) (252) (320)
Total consumer charge-offs (6,368)(9,261) (15,576) (21,538) (31,780)
U.S. commercial (2) (584) (774) (1,309) (1,690) (3,190)
Commercial real estate (29) (251) (719) (1,298) (2,185)
Commercial lease financing (10) (4) (32) (61) (96)
Non-U.S. commercial (35) (79) (36) (155) (139)
Total commercial charge-offs (658) (1,108) (2,096) (3,204) (5,610)
Total loans and leases charged off (7,026)(10,369) (17,672) (24,742) (37,390)
Recoveries of loans and leases previously charged off
Residential mortgage 969 424 165 377 117
Home equity 457 455 331 517 279
U.S. credit card 430 628 728 838 791
Non-U.S. credit card 115 109 254 522 217
Direct/Indirect consumer 287 365 495 714 967
Other consumer 39 39 42 50 59
Total consumer recoveries 2,297 2,020 2,015 3,018 2,430
U.S. commercial (3) 214 287 368 500 391
Commercial real estate 112 102 335 351 168
Commercial lease financing 19 29 38 37 39
Non-U.S. commercial 1348328
Total commercial recoveries 346 452 749 891 626
Total recoveries of loans and leases previously charged off 2,643 2,472 2,764 3,909 3,056
Net charge-offs (4,383)(7,897) (14,908) (20,833) (34,334)
Write-offs of PCI loans (810) (2,336) (2,820) — —
Provision for loan and lease losses 2,231 3,574 8,310 13,629 28,195
Other (4) (47) (92) (186) (898) 36
Allowance for loan and lease losses, December 31 14,419 17,428 24,179 33,783 41,885
Reserve for unfunded lending commitments, January 1 484 513 714 1,188 1,487
Provision for unfunded lending commitments 44 (18) (141) (219) 240
Other (5) —(11) (60) (255) (539)
Reserve for unfunded lending commitments, December 31 528 484 513 714 1,188
Allowance for credit losses, December 31 $ 14,947 $ 17,912 $ 24,692 $ 34,497 $ 43,073
(1) The 2010 balance includes $10.8 billion of allowance for loan and lease losses related to the adoption of consolidation guidance that was effective January 1, 2010.
(2) Includes U.S. small business commercial charge-offs of $345 million, $457 million, $799 million, $1.1 billion and $2.0 billion in 2014, 2013, 2012, 2011 and 2010, respectively.
(3) Includes U.S. small business commercial recoveries of $63 million, $98 million, $100 million, $106 million and $107 million in 2014, 2013, 2012, 2011 and 2010, respectively.
(4) The 2014, 2013, 2012 and 2011 amounts primarily represent the net impact of portfolio sales, consolidations and deconsolidations, and foreign currency translation adjustments. In addition, the
2011 amount includes a $449 million reduction in the allowance for loan and lease losses related to Canadian consumer card loans that were transferred to LHFS.
(5) Primarily represents accretion of the Merrill Lynch purchase accounting adjustment and the impact of funding previously unfunded positions.