Bank of America 2014 Annual Report Download - page 71
Download and view the complete annual report
Please find page 71 of the 2014 Bank of America annual report below. You can navigate through the pages in the report by either clicking on the pages listed below, or by using the keyword search tool below to find specific information within the annual report.-
 1
1 -
2
-
3
-
4
-
5
-
6
-
7
-
8
-
9
-
10
-
11
-
12
-
13
-
14
-
15
-
16
-
17
-
18
-
19
-
20
-
21
-
22
-
23
-
24
-
25
-
26
-
27
-
28
-
29
-
30
-
31
-
32
-
33
-
34
-
35
-
36
-
37
-
38
-
39
-
40
-
41
-
42
-
43
-
44
-
45
-
46
-
47
-
48
-
49
-
50
-
51
-
52
-
53
-
54
-
55
-
56
-
57
-
58
-
59
-
60
-
 61
61 -
 62
62 -
 63
63 -
 64
64 -
 65
65 -
 66
66 -
 67
67 -
 68
68 -
 69
69 -
 70
70 -
 71
71 -
 72
72 -
 73
73 -
 74
74 -
 75
75 -
 76
76 -
 77
77 -
 78
78 -
 79
79 -
 80
80 -
 81
81 -
82
-
83
-
84
-
85
-
86
-
87
-
88
-
89
-
90
-
91
-
92
-
93
-
94
-
95
-
96
-
97
-
98
-
99
-
100
-
101
-
102
-
103
-
104
-
105
-
106
-
107
-
108
-
109
-
110
-
111
-
112
-
113
-
114
-
115
-
116
-
117
-
118
-
119
-
120
-
121
-
122
-
123
-
124
-
125
-
126
-
127
-
128
-
129
-
130
-
131
-
132
-
133
-
134
-
135
-
136
-
137
-
138
-
139
-
140
-
141
-
142
-
143
-
144
-
145
-
146
-
147
-
148
-
149
-
150
-
151
-
152
-
153
-
154
-
155
-
156
-
157
-
158
-
159
-
160
-
161
-
162
-
163
-
164
-
165
-
166
-
167
-
168
-
169
-
170
-
171
-
172
-
173
-
174
-
175
-
176
-
177
-
178
-
179
-
180
-
181
-
182
-
183
-
184
-
185
-
186
-
187
-
188
-
189
-
190
-
191
-
192
-
193
-
194
-
195
-
196
-
197
-
198
-
199
-
200
-
201
-
202
-
203
-
204
-
205
-
206
-
207
-
208
-
209
-
210
-
211
-
212
-
213
-
214
-
215
-
216
-
217
-
218
-
219
-
220
-
221
-
222
-
223
-
224
-
225
-
226
-
227
-
228
-
229
-
230
-
231
-
232
-
233
-
234
-
235
-
236
-
237
-
238
-
239
-
240
-
241
-
242
-
243
-
244
-
245
-
246
-
247
-
248
-
249
-
250
-
251
-
252
-
253
-
254
-
255
-
256
-
257
-
258
-
259
-
260
-
261
-
262
-
263
-
264
-
265
-
266
-
267
-
268
-
269
-
270
-
271
-
272
 |
 |

Bank of America 2014 69
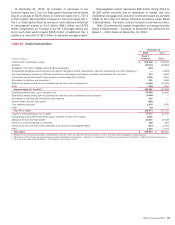
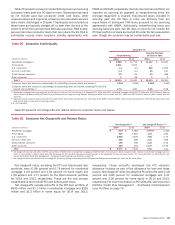
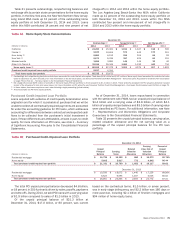
Table 25 presents consumer nonperforming loans and accruing
consumer loans past due 90 days or more. Nonperforming loans
do not include past due consumer credit card loans, other
unsecured loans and in general, consumer non-real estate-secured
loans (loans discharged in Chapter 7 bankruptcy are included) as
these loans are typically charged off no later than the end of the
month in which the loan becomes 180 days past due. Real estate-
secured past due consumer loans that are insured by the FHA or
individually insured under long-term standby agreements with
FNMA and FHLMC (collectively, the fully-insured loan portfolio) are
reported as accruing as opposed to nonperforming since the
principal repayment is insured. Fully-insured loans included in
accruing past due 90 days or more are primarily from our
repurchases of delinquent FHA loans pursuant to our servicing
agreements with GNMA. Additionally, nonperforming loans and
accruing balances past due 90 days or more do not include the
PCI loan portfolio or loans accounted for under the fair value option
even though the customer may be contractually past due.
Table 25 Consumer Credit Quality
December 31
Nonperforming
Accruing Past Due
90 Days or More
(Dollars in millions) 2014 2013 2014 2013
Residential mortgage (1) $ 6,889 $ 11,712 $11,407 $ 16,961
Home equity 3,901 4,075 ——
U.S. credit card n/a n/a 866 1,053
Non-U.S. credit card n/a n/a 95 131
Direct/Indirect consumer 28 35 64 408
Other consumer 118 12
Total (2) $ 10,819 $ 15,840 $12,433 $ 18,555
Consumer loans and leases as a percentage of outstanding consumer loans and leases (2) 2.22%2.99% 2.56%3.50%
Consumer loans and leases as a percentage of outstanding loans and leases, excluding PCI and fully-
insured loan portfolios (2) 2.70 3.80 0.26 0.38
(1) Residential mortgage loans accruing past due 90 days or more are fully-insured loans. At December 31, 2014 and 2013, residential mortgage included $7.3 billion and $13.0 billion of loans on
which interest has been curtailed by the FHA, and therefore are no longer accruing interest, although principal is still insured, and $4.1 billion and $4.0 billion of loans on which interest was still
accruing.
(2) Balances exclude consumer loans accounted for under the fair value option. At December 31, 2014 and 2013, $392 million and $445 million of loans accounted for under the fair value option were
past due 90 days or more and not accruing interest.
n/a = not applicable
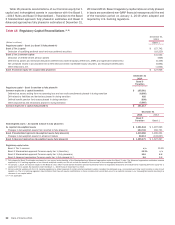
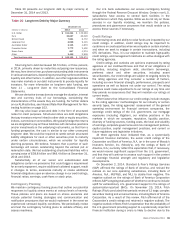
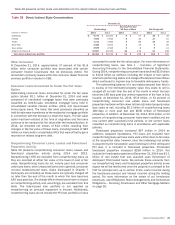
Table 26 presents net charge-offs and related ratios for consumer loans and leases.
Table 26 Consumer Net Charge-offs and Related Ratios
Net Charge-offs (1) Net Charge-off Ratios (1, 2)
(Dollars in millions) 2014 2013 2014 2013
Residential mortgage $ (114) $ 1,084 (0.05)% 0.42%
Home equity 907 1,803 1.01 1.80
U.S. credit card 2,638 3,376 2.96 3.74
Non-U.S. credit card 242 399 2.10 3.68
Direct/Indirect consumer 169 345 0.20 0.42
Other consumer 229 234 11.27 12.96
Total $ 4,071 $ 7,241 0.80 1.34
(1) Net charge-offs exclude write-offs in the PCI loan portfolio of $545 million in residential mortgage and $265 million in home equity in 2014 compared to $1.1 billion in residential mortgage and $1.2
billion in home equity in 2013. These write-offs decreased the PCI valuation allowance included as part of the allowance for loan and lease losses. For more information on PCI write-offs, see
Consumer Portfolio Credit Risk Management – Purchased Credit-impaired Loan Portfolio on page 75.
(2) Net charge-off ratios are calculated as net charge-offs divided by average outstanding loans and leases excluding loans accounted for under the fair value option.
Net charge-off ratios, excluding the PCI and fully-insured loan
portfolios, were (0.08) percent and 0.74 percent for residential
mortgage, 1.09 percent and 1.94 percent for home equity and
1.00 percent and 1.71 percent for the total consumer portfolio
for 2014 and 2013, respectively. These are the only product
classifications that include PCI and fully-insured loans.
Net charge-offs exclude write-offs in the PCI loan portfolio of
$545 million and $1.1 billion in residential mortgage and $265
million and $1.2 billion in home equity for 2014 and 2013,
respectively. These write-offs decreased the PCI valuation
allowance included as part of the allowance for loan and lease
losses. Net charge-off ratios including the PCI write-offs were 0.18
percent and 0.85 percent for residential mortgage and 1.31
percent and 3.05 percent for home equity in 2014 and 2013,
respectively. For more information on PCI write-offs, see Consumer
Portfolio Credit Risk Management – Purchased Credit-impaired
Loan Portfolio on page 75.