Bank of America 2014 Annual Report Download - page 79
Download and view the complete annual report
Please find page 79 of the 2014 Bank of America annual report below. You can navigate through the pages in the report by either clicking on the pages listed below, or by using the keyword search tool below to find specific information within the annual report.-
 1
1 -
2
-
3
-
4
-
5
-
6
-
7
-
8
-
9
-
10
-
11
-
12
-
13
-
14
-
15
-
16
-
17
-
18
-
19
-
20
-
21
-
22
-
23
-
24
-
25
-
26
-
27
-
28
-
29
-
30
-
31
-
32
-
33
-
34
-
35
-
36
-
37
-
38
-
39
-
40
-
41
-
42
-
43
-
44
-
45
-
46
-
47
-
48
-
49
-
50
-
51
-
52
-
53
-
54
-
55
-
56
-
57
-
58
-
59
-
60
-
61
-
62
-
63
-
64
-
65
-
66
-
67
-
68
-
 69
69 -
 70
70 -
 71
71 -
 72
72 -
 73
73 -
 74
74 -
 75
75 -
 76
76 -
 77
77 -
 78
78 -
 79
79 -
 80
80 -
 81
81 -
 82
82 -
 83
83 -
 84
84 -
 85
85 -
 86
86 -
 87
87 -
 88
88 -
 89
89 -
90
-
91
-
92
-
93
-
94
-
95
-
96
-
97
-
98
-
99
-
100
-
101
-
102
-
103
-
104
-
105
-
106
-
107
-
108
-
109
-
110
-
111
-
112
-
113
-
114
-
115
-
116
-
117
-
118
-
119
-
120
-
121
-
122
-
123
-
124
-
125
-
126
-
127
-
128
-
129
-
130
-
131
-
132
-
133
-
134
-
135
-
136
-
137
-
138
-
139
-
140
-
141
-
142
-
143
-
144
-
145
-
146
-
147
-
148
-
149
-
150
-
151
-
152
-
153
-
154
-
155
-
156
-
157
-
158
-
159
-
160
-
161
-
162
-
163
-
164
-
165
-
166
-
167
-
168
-
169
-
170
-
171
-
172
-
173
-
174
-
175
-
176
-
177
-
178
-
179
-
180
-
181
-
182
-
183
-
184
-
185
-
186
-
187
-
188
-
189
-
190
-
191
-
192
-
193
-
194
-
195
-
196
-
197
-
198
-
199
-
200
-
201
-
202
-
203
-
204
-
205
-
206
-
207
-
208
-
209
-
210
-
211
-
212
-
213
-
214
-
215
-
216
-
217
-
218
-
219
-
220
-
221
-
222
-
223
-
224
-
225
-
226
-
227
-
228
-
229
-
230
-
231
-
232
-
233
-
234
-
235
-
236
-
237
-
238
-
239
-
240
-
241
-
242
-
243
-
244
-
245
-
246
-
247
-
248
-
249
-
250
-
251
-
252
-
253
-
254
-
255
-
256
-
257
-
258
-
259
-
260
-
261
-
262
-
263
-
264
-
265
-
266
-
267
-
268
-
269
-
270
-
271
-
272
 |
 |

Bank of America 2014 77
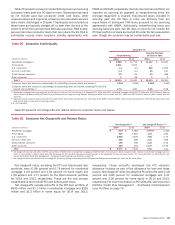
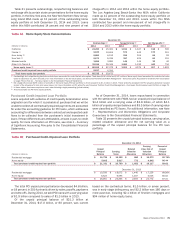
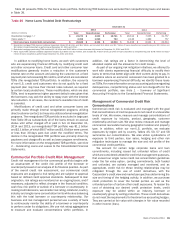
Purchased Credit-impaired Home Equity Loan Portfolio
The PCI home equity portfolio represented 27 percent of the total
PCI loan portfolio at December 31, 2014. Those loans with a
refreshed FICO score below 620 represented 15 percent of the
PCI home equity portfolio at December 31, 2014. Loans with a
refreshed CLTV greater than 90 percent, after consideration of
purchase accounting adjustments and the related valuation
allowance, represented 64 percent of the PCI home equity portfolio
and 68 percent based on the unpaid principal balance at
December 31, 2014. Table 34 presents outstandings net of
purchase accounting adjustments and before the related valuation
allowance, by certain state concentrations.
Table 34 Outstanding Purchased Credit-impaired Loan
Portfolio – Home Equity State Concentrations
December 31
(Dollars in millions) 2014 2013
California $ 1,646 $ 1,921
Florida (1) 313 356
Virginia 265 310
Arizona 188 214
Colorado 151 199
Other U.S./Non-U.S. 3,054 3,593
Total $ 5,617 $ 6,593
(1) In this state, foreclosure requires a court order following a legal proceeding (judicial state).
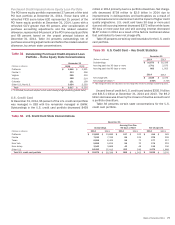
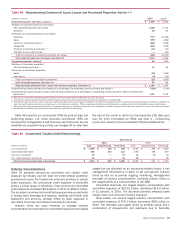
U.S. Credit Card
At December 31, 2014, 96 percent of the U.S. credit card portfolio
was managed in CBB with the remainder managed in GWIM.
Outstandings in the U.S. credit card portfolio decreased $459
million in 2014 primarily due to a portfolio divestiture. Net charge-
offs decreased $738 million to $2.6 billion in 2014 due to
improvements in delinquencies and bankruptcies as a result of
an improved economic environment and the impact of higher credit
quality originations. U.S. credit card loans 30 days or more past
due and still accruing interest decreased $372 million while loans
90 days or more past due and still accruing interest decreased
$187 million in 2014 as a result of the factors mentioned above
that contributed to lower net charge-offs.
Table 35 presents certain key credit statistics for the U.S. credit
card portfolio.
Table 35 U.S. Credit Card – Key Credit Statistics
December 31
(Dollars in millions) 2014 2013
Outstandings $ 91,879 $ 92,338
Accruing past due 30 days or more 1,701 2,073
Accruing past due 90 days or more 866 1,053
2014 2013
Net charge-offs $ 2,638 $ 3,376
Net charge-off ratios (1) 2.96% 3.74%
(1) Net charge-off ratios are calculated as net charge-offs divided by average outstanding loans.
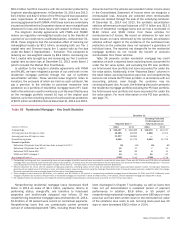
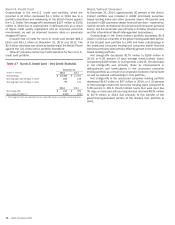
Unused lines of credit for U.S. credit card totaled $305.9 billion
and $315.1 billion at December 31, 2014 and 2013. The $9.2
billion decrease was driven by the closure of inactive accounts and
a portfolio divestiture.
Table 36 presents certain state concentrations for the U.S.
credit card portfolio.
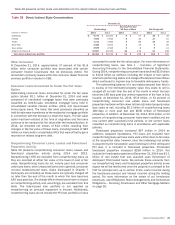
Table 36 U.S. Credit Card State Concentrations
December 31
Outstandings
Accruing Past Due
90 Days or More Net Charge-offs
(Dollars in millions) 2014 2013 2014 2013 2014 2013
California $ 13,682 $ 13,689 $127 $ 162 $414 $ 562
Florida 7,530 7,339 89 105 278 359
Texas 6,586 6,405 58 72 177 217
New York 5,655 5,624 59 70 174 219
New Jersey 3,943 3,868 40 48 116 150
Other U.S. 54,483 55,413 493 596 1,479 1,869
Total U.S. credit card portfolio $ 91,879 $ 92,338 $866 $ 1,053 $ 2,638 $ 3,376