Bank of America 2014 Annual Report Download - page 135
Download and view the complete annual report
Please find page 135 of the 2014 Bank of America annual report below. You can navigate through the pages in the report by either clicking on the pages listed below, or by using the keyword search tool below to find specific information within the annual report.-
 1
1 -
2
-
3
-
4
-
5
-
6
-
7
-
8
-
9
-
10
-
11
-
12
-
13
-
14
-
15
-
16
-
17
-
18
-
19
-
20
-
21
-
22
-
23
-
24
-
25
-
26
-
27
-
28
-
29
-
30
-
31
-
32
-
33
-
34
-
35
-
36
-
37
-
38
-
39
-
40
-
41
-
42
-
43
-
44
-
45
-
46
-
47
-
48
-
49
-
50
-
51
-
52
-
53
-
54
-
55
-
56
-
57
-
58
-
59
-
60
-
61
-
62
-
63
-
64
-
65
-
66
-
67
-
68
-
69
-
70
-
71
-
72
-
73
-
74
-
75
-
76
-
77
-
78
-
79
-
80
-
81
-
82
-
83
-
84
-
85
-
86
-
87
-
88
-
89
-
90
-
91
-
92
-
93
-
94
-
95
-
96
-
97
-
98
-
99
-
100
-
101
-
102
-
103
-
104
-
105
-
106
-
107
-
108
-
109
-
110
-
111
-
112
-
113
-
114
-
115
-
116
-
117
-
118
-
119
-
120
-
121
-
122
-
123
-
124
-
 125
125 -
 126
126 -
 127
127 -
 128
128 -
 129
129 -
 130
130 -
 131
131 -
 132
132 -
 133
133 -
 134
134 -
 135
135 -
 136
136 -
 137
137 -
 138
138 -
 139
139 -
 140
140 -
 141
141 -
 142
142 -
 143
143 -
 144
144 -
 145
145 -
146
-
147
-
148
-
149
-
150
-
151
-
152
-
153
-
154
-
155
-
156
-
157
-
158
-
159
-
160
-
161
-
162
-
163
-
164
-
165
-
166
-
167
-
168
-
169
-
170
-
171
-
172
-
173
-
174
-
175
-
176
-
177
-
178
-
179
-
180
-
181
-
182
-
183
-
184
-
185
-
186
-
187
-
188
-
189
-
190
-
191
-
192
-
193
-
194
-
195
-
196
-
197
-
198
-
199
-
200
-
201
-
202
-
203
-
204
-
205
-
206
-
207
-
208
-
209
-
210
-
211
-
212
-
213
-
214
-
215
-
216
-
217
-
218
-
219
-
220
-
221
-
222
-
223
-
224
-
225
-
226
-
227
-
228
-
229
-
230
-
231
-
232
-
233
-
234
-
235
-
236
-
237
-
238
-
239
-
240
-
241
-
242
-
243
-
244
-
245
-
246
-
247
-
248
-
249
-
250
-
251
-
252
-
253
-
254
-
255
-
256
-
257
-
258
-
259
-
260
-
261
-
262
-
263
-
264
-
265
-
266
-
267
-
268
-
269
-
270
-
271
-
272
 |
 |

Bank of America 2014 133
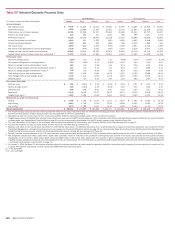
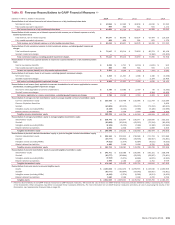
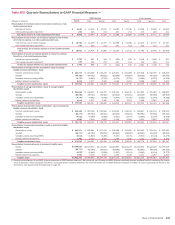
Table XVII Quarterly Reconciliations to GAAP Financial Measures (1)
2014 Quarters 2013 Quarters
(Dollars in millions) Fourth Third Second First Fourth Third Second First
Reconciliation of net interest income to net interest income on a fully
taxable-equivalent basis
Net interest income $ 9,635 $ 10,219 $ 10,013 $ 10,085 $ 10,786 $ 10,266 $10,549 $10,664
Fully taxable-equivalent adjustment 230 225 213 201 213 213 222 211
Net interest income on a fully taxable-equivalent basis $ 9,865 $ 10,444 $ 10,226 $ 10,286 $ 10,999 $ 10,479 $10,771 $10,875
Reconciliation of total revenue, net of interest expense to total revenue,
net of interest expense on a fully taxable-equivalent basis
Total revenue, net of interest expense $ 18,725 $ 21,209 $ 21,747 $ 22,566 $ 21,488 $ 21,530 $22,727 $23,197
Fully taxable-equivalent adjustment 230 225 213 201 213 213 222 211
Total revenue, net of interest expense on a fully taxable-equivalent
basis $ 18,955 $ 21,434 $ 21,960 $ 22,767 $ 21,701 $ 21,743 $22,949 $23,408
Reconciliation of income tax expense (benefit) to income tax expense
(benefit) on a fully taxable-equivalent basis
Income tax expense (benefit) $ 1,260 $663 $ 504 $ (405) $ 406 $ 2,348 $ 1,486 $ 501
Fully taxable-equivalent adjustment 230 225 213 201 213 213 222 211
Income tax expense (benefit) on a fully taxable-equivalent basis $ 1,490 $888 $ 717 $ (204) $ 619 $ 2,561 $ 1,708 $ 712
Reconciliation of average common shareholders’ equity to average
tangible common shareholders’ equity
Common shareholders’ equity $ 224,473 $ 222,368 $ 222,215 $ 223,201 $ 220,088 $ 216,766 $ 218,790 $ 218,225
Goodwill (69,782) (69,792) (69,822) (69,842) (69,864) (69,903) (69,930) (69,945)
Intangible assets (excluding MSRs) (4,747) (4,992) (5,235) (5,474) (5,725) (5,993) (6,270) (6,549)
Related deferred tax liabilities 2,019 2,077 2,100 2,165 2,231 2,296 2,360 2,425
Tangible common shareholders’ equity $ 151,963 $ 149,661 $ 149,258 $ 150,050 $ 146,730 $ 143,166 $ 144,950 $ 144,156
Reconciliation of average shareholders’ equity to average tangible
shareholders’ equity
Shareholders’ equity $ 243,448 $ 238,034 $ 235,797 $ 236,553 $ 233,415 $ 230,392 $ 235,063 $ 236,995
Goodwill (69,782) (69,792) (69,822) (69,842) (69,864) (69,903) (69,930) (69,945)
Intangible assets (excluding MSRs) (4,747) (4,992) (5,235) (5,474) (5,725) (5,993) (6,270) (6,549)
Related deferred tax liabilities 2,019 2,077 2,100 2,165 2,231 2,296 2,360 2,425
Tangible shareholders’ equity $ 170,938 $ 165,327 $ 162,840 $ 163,402 $ 160,057 $ 156,792 $ 161,223 $ 162,926
Reconciliation of period-end common shareholders’ equity to period-end
tangible common shareholders’ equity
Common shareholders’ equity $ 224,162 $ 220,768 $ 222,565 $ 218,536 $ 219,333 $ 218,967 $ 216,791 $ 218,513
Goodwill (69,777) (69,784) (69,810) (69,842) (69,844) (69,891) (69,930) (69,930)
Intangible assets (excluding MSRs) (4,612) (4,849) (5,099) (5,337) (5,574) (5,843) (6,104) (6,379)
Related deferred tax liabilities 1,960 2,019 2,078 2,100 2,166 2,231 2,297 2,363
Tangible common shareholders’ equity $ 151,733 $ 148,154 $ 149,734 $ 145,457 $ 146,081 $ 145,464 $ 143,054 $ 144,567
Reconciliation of period-end shareholders’ equity to period-end tangible
shareholders’ equity
Shareholders’ equity $ 243,471 $ 238,681 $ 237,411 $ 231,888 $ 232,685 $ 232,282 $ 231,032 $ 237,293
Goodwill (69,777) (69,784) (69,810) (69,842) (69,844) (69,891) (69,930) (69,930)
Intangible assets (excluding MSRs) (4,612) (4,849) (5,099) (5,337) (5,574) (5,843) (6,104) (6,379)
Related deferred tax liabilities 1,960 2,019 2,078 2,100 2,166 2,231 2,297 2,363
Tangible shareholders’ equity $ 171,042 $ 166,067 $ 164,580 $ 158,809 $ 159,433 $ 158,779 $ 157,295 $ 163,347
Reconciliation of period-end assets to period-end tangible assets
Assets $ 2,104,534 $2,123,613 $2,170,557 $2,149,851 $2,102,273 $2,126,653 $2,123,320 $2,174,819
Goodwill (69,777) (69,784) (69,810) (69,842) (69,844) (69,891) (69,930) (69,930)
Intangible assets (excluding MSRs) (4,612) (4,849) (5,099) (5,337) (5,574) (5,843) (6,104) (6,379)
Related deferred tax liabilities 1,960 2,019 2,078 2,100 2,166 2,231 2,297 2,363
Tangible assets $ 2,032,105 $2,050,999 $2,097,726 $2,076,772 $2,029,021 $2,053,150 $2,049,583 $2,100,873
(1) Presents reconciliations of non-GAAP financial measures to GAAP financial measures. We believe the use of these non-GAAP financial measures provides additional clarity in assessing the results
of the Corporation. Other companies may define or calculate these measures differently. For more information on non-GAAP financial measures and ratios we use in assessing the results of the
Corporation, see Supplemental Financial Data on page 29.