Bank of America 2014 Annual Report Download - page 63
Download and view the complete annual report
Please find page 63 of the 2014 Bank of America annual report below. You can navigate through the pages in the report by either clicking on the pages listed below, or by using the keyword search tool below to find specific information within the annual report.-
 1
1 -
2
-
3
-
4
-
5
-
6
-
7
-
8
-
9
-
10
-
11
-
12
-
13
-
14
-
15
-
16
-
17
-
18
-
19
-
20
-
21
-
22
-
23
-
24
-
25
-
26
-
27
-
28
-
29
-
30
-
31
-
32
-
33
-
34
-
35
-
36
-
37
-
38
-
39
-
40
-
41
-
42
-
43
-
44
-
45
-
46
-
47
-
48
-
49
-
50
-
51
-
52
-
 53
53 -
 54
54 -
 55
55 -
 56
56 -
 57
57 -
 58
58 -
 59
59 -
 60
60 -
 61
61 -
 62
62 -
 63
63 -
 64
64 -
 65
65 -
 66
66 -
 67
67 -
 68
68 -
 69
69 -
 70
70 -
 71
71 -
 72
72 -
 73
73 -
74
-
75
-
76
-
77
-
78
-
79
-
80
-
81
-
82
-
83
-
84
-
85
-
86
-
87
-
88
-
89
-
90
-
91
-
92
-
93
-
94
-
95
-
96
-
97
-
98
-
99
-
100
-
101
-
102
-
103
-
104
-
105
-
106
-
107
-
108
-
109
-
110
-
111
-
112
-
113
-
114
-
115
-
116
-
117
-
118
-
119
-
120
-
121
-
122
-
123
-
124
-
125
-
126
-
127
-
128
-
129
-
130
-
131
-
132
-
133
-
134
-
135
-
136
-
137
-
138
-
139
-
140
-
141
-
142
-
143
-
144
-
145
-
146
-
147
-
148
-
149
-
150
-
151
-
152
-
153
-
154
-
155
-
156
-
157
-
158
-
159
-
160
-
161
-
162
-
163
-
164
-
165
-
166
-
167
-
168
-
169
-
170
-
171
-
172
-
173
-
174
-
175
-
176
-
177
-
178
-
179
-
180
-
181
-
182
-
183
-
184
-
185
-
186
-
187
-
188
-
189
-
190
-
191
-
192
-
193
-
194
-
195
-
196
-
197
-
198
-
199
-
200
-
201
-
202
-
203
-
204
-
205
-
206
-
207
-
208
-
209
-
210
-
211
-
212
-
213
-
214
-
215
-
216
-
217
-
218
-
219
-
220
-
221
-
222
-
223
-
224
-
225
-
226
-
227
-
228
-
229
-
230
-
231
-
232
-
233
-
234
-
235
-
236
-
237
-
238
-
239
-
240
-
241
-
242
-
243
-
244
-
245
-
246
-
247
-
248
-
249
-
250
-
251
-
252
-
253
-
254
-
255
-
256
-
257
-
258
-
259
-
260
-
261
-
262
-
263
-
264
-
265
-
266
-
267
-
268
-
269
-
270
-
271
-
272
 |
 |

Bank of America 2014 61
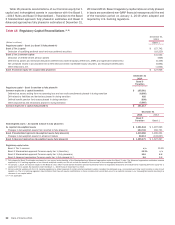
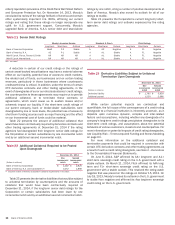
Bank of America, N.A. Regulatory Capital
Prior to October 1, 2014, we operated our banking activities
primarily under two charters: BANA and, to a lesser extent, FIA.
On October 1, 2014, FIA was merged into BANA. Table 17 presents
regulatory capital information for BANA at December 31, 2014 and
2013.
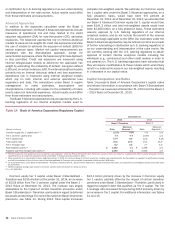
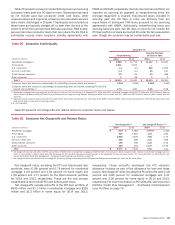
Table 17 Bank of America, N.A. Regulatory Capital
December 31
2014 2013
(Dollars in millions) Ratio Amount
Minimum
Required (1) Ratio Amount
Minimum
Required (1)
Common equity tier 1 capital (2) 13.1% $ 145,150 4.0% n/a n/a n/a
Tier 1 capital 13.1 145,150 6.0 12.3% $ 125,886 6.0%
Total capital 14.6 161,623 10.0 13.8 141,232 10.0
Tier 1 leverage 9.6 145,150 5.0 9.2 125,886 5.0
(1) Percent required to meet guidelines to be considered “well capitalized” under the Prompt Corrective Action framework, except for Common equity tier 1 capital which reflects capital adequacy minimum
requirements as an advanced approaches bank under Basel 3 during a transition period in 2014.
(2) When presented on a fully phased-in basis, beginning January 1, 2019, the minimum Basel 3 Common equity tier 1 capital ratio requirement for BANA is expected to significantly increase and will
be comprised of the minimum ratio of the then-applicable 4.5 percent, plus a capital conservation buffer and the GSIB buffer.
n/a = not applicable
BANA’s Tier 1 capital ratio under Basel 3 Standardized –
Transition was 13.1 percent at December 31, 2014, an increase
of 80 bps from December 31, 2013. The increase was largely
attributable to the merger of FIA into BANA in 2014. The Total
capital ratio increased 79 bps to 14.6 percent at December 31,
2014 compared to December 31, 2013. The Tier 1 leverage ratio
increased 42 bps to 9.6 percent. The increase in the Total capital
ratio was driven by the same factors as the Tier 1 capital ratio.
The increase in the Tier 1 leverage ratio was driven by an increase
in Tier 1 capital, partially offset by an increase in adjusted quarterly
average total assets. Further, the merger with FIA positively
impacted these ratios.
Other Regulatory Capital Matters
Supplementary Leverage Ratio
Basel 3 also will require the calculation of a supplementary
leverage ratio (SLR). The SLR is determined by dividing Tier 1
capital, using quarter-end Basel 3 Tier 1 capital on a fully phased-
in basis, by supplementary leverage exposure calculated as the
daily average of the sum of on-balance sheet as well as the simple
average of certain off-balance sheet exposures at the end of each
month in the quarter. Supplementary leverage exposure is
comprised of all on-balance sheet assets, plus a measure of
certain off-balance sheet exposures, including among other items,
lending commitments, letters of credit, OTC derivatives, repo-style
transactions and margin loan commitments. We are required to
disclose our SLR effective January 1, 2015. Effective January 1,
2018, the Corporation will be required to maintain a minimum SLR
of 3.0 percent, plus a supplementary leverage buffer of 2.0
percent, for a total SLR of 5.0 percent. If the Corporation’s
supplementary leverage buffer is not greater than or equal to 2.0
percent, then the Corporation will be subject to mandatory limits
on its ability to make distributions of capital to shareholders,
whether through dividends, stock repurchases or otherwise. In
addition, the insured depository institutions of such BHCs, which
for the Corporation is primarily BANA, will be required to maintain
a minimum 6.0 percent SLR to be considered “well capitalized.”
On September 3, 2014, U.S. banking regulators adopted a final
rule to revise the definition and scope of the denominator of the
SLR. The final rule prescribes the calculation of total leverage
exposure, the frequency of calculation and required disclosures.
The definition of total leverage exposure is revised to include the
effective notional principal amount of credit derivatives and other
similar instruments through which credit protection is sold.
Calculations of the components of total leverage exposure for
derivative and repo-style transactions are modified. The credit
conversion factors (CCF) applied to certain off-balance sheet
exposures are conformed to the graduated CCF used by the
Standardized approach, subject to the minimum 10 percent credit
conversion factor.
As of December 31, 2014, we estimate the Corporation’s SLR
would have been approximately 5.9 percent, which exceeds the
5.0 percent threshold that represents the minimum plus the
supplementary leverage buffer for BHCs. The estimated SLR for
BANA was approximately 7.0 percent, which exceeds the 6.0
percent “well capitalized” level for insured depository institutions
of BHCs.
Global Systemically Important Bank Surcharge
In November 2011, the Basel Committee on Banking Supervision
(Basel Committee) published a methodology to identify global
systemically important banks (GSIBs) and impose an additional
loss absorbency requirement through the introduction of a
surcharge of up to 3.5 percent, which must be satisfied with
Common equity tier 1 capital. The assessment methodology relies
on an indicator-based measurement approach to determine a
score relative to the global banking industry. The chosen indicators
are size, complexity, cross-jurisdictional activity, inter-
connectedness and substitutability/financial institution
infrastructure. Institutions with the highest scores are designated
as GSIBs and are assigned to one of four loss absorbency buckets
from 1.0 percent to 2.5 percent, in 0.5 percent increments based
on each institution’s relative score and supervisory judgment. The
fifth loss absorbency bucket of 3.5 percent is currently empty and
serves to discourage banks from becoming more systemically
important. Also in November 2011, the Financial Stability Board
(FSB) published an integrated set of policy measures and identified
an initial group of GSIBs, which included the Corporation.
In July 2013, the Basel Committee updated the November
2011 methodology to recalibrate the substitutability/financial
institution infrastructure indicator by introducing a cap on the
weighting of that component, and requiring the annual publication
by the FSB of key information necessary to permit each GSIB to
calculate its score and observe its position within the buckets and
relative to the industry total for each indicator. Every three years,