Bank of America 2014 Annual Report Download - page 164
Download and view the complete annual report
Please find page 164 of the 2014 Bank of America annual report below. You can navigate through the pages in the report by either clicking on the pages listed below, or by using the keyword search tool below to find specific information within the annual report.-
 1
1 -
2
-
3
-
4
-
5
-
6
-
7
-
8
-
9
-
10
-
11
-
12
-
13
-
14
-
15
-
16
-
17
-
18
-
19
-
20
-
21
-
22
-
23
-
24
-
25
-
26
-
27
-
28
-
29
-
30
-
31
-
32
-
33
-
34
-
35
-
36
-
37
-
38
-
39
-
40
-
41
-
42
-
43
-
44
-
45
-
46
-
47
-
48
-
49
-
50
-
51
-
52
-
53
-
54
-
55
-
56
-
57
-
58
-
59
-
60
-
61
-
62
-
63
-
64
-
65
-
66
-
67
-
68
-
69
-
70
-
71
-
72
-
73
-
74
-
75
-
76
-
77
-
78
-
79
-
80
-
81
-
82
-
83
-
84
-
85
-
86
-
87
-
88
-
89
-
90
-
91
-
92
-
93
-
94
-
95
-
96
-
97
-
98
-
99
-
100
-
101
-
102
-
103
-
104
-
105
-
106
-
107
-
108
-
109
-
110
-
111
-
112
-
113
-
114
-
115
-
116
-
117
-
118
-
119
-
120
-
121
-
122
-
123
-
124
-
125
-
126
-
127
-
128
-
129
-
130
-
131
-
132
-
133
-
134
-
135
-
136
-
137
-
138
-
139
-
140
-
141
-
142
-
143
-
144
-
145
-
146
-
147
-
148
-
149
-
150
-
151
-
152
-
153
-
 154
154 -
 155
155 -
 156
156 -
 157
157 -
 158
158 -
 159
159 -
 160
160 -
 161
161 -
 162
162 -
 163
163 -
 164
164 -
 165
165 -
 166
166 -
 167
167 -
 168
168 -
 169
169 -
 170
170 -
 171
171 -
 172
172 -
 173
173 -
 174
174 -
175
-
176
-
177
-
178
-
179
-
180
-
181
-
182
-
183
-
184
-
185
-
186
-
187
-
188
-
189
-
190
-
191
-
192
-
193
-
194
-
195
-
196
-
197
-
198
-
199
-
200
-
201
-
202
-
203
-
204
-
205
-
206
-
207
-
208
-
209
-
210
-
211
-
212
-
213
-
214
-
215
-
216
-
217
-
218
-
219
-
220
-
221
-
222
-
223
-
224
-
225
-
226
-
227
-
228
-
229
-
230
-
231
-
232
-
233
-
234
-
235
-
236
-
237
-
238
-
239
-
240
-
241
-
242
-
243
-
244
-
245
-
246
-
247
-
248
-
249
-
250
-
251
-
252
-
253
-
254
-
255
-
256
-
257
-
258
-
259
-
260
-
261
-
262
-
263
-
264
-
265
-
266
-
267
-
268
-
269
-
270
-
271
-
272
 |
 |

162 Bank of America 2014
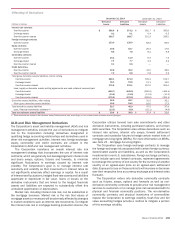
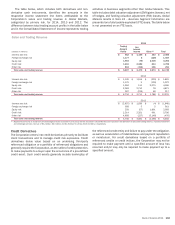
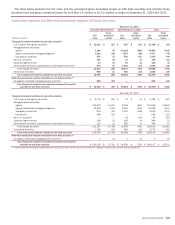
Other Risk Management Derivatives
Other risk management derivatives are used by the Corporation
to reduce certain risk exposures. These derivatives are not
qualifying accounting hedges because either they did not qualify
for or were not designated as accounting hedges. The table below
presents gains (losses) on these derivatives for 2014, 2013 and
2012. These gains (losses) are largely offset by the income or
expense that is recorded on the hedged item. The change in the
impact of interest rate and foreign currency risk on ALM activities
was primarily driven by decreasing interest rates and foreign
currency weakening against the U.S. Dollar throughout 2014
compared to strengthening during 2013.
Other Risk Management Derivatives
Gains (Losses)
(Dollars in millions) 2014 2013 2012
Interest rate risk on mortgage banking income (1) $ 1,017 $ (619) $ 1,324
Credit risk on loans (2) 16 (47) (95)
Interest rate and foreign currency risk on ALM activities (3) (3,683)2,501 424
Price risk on restricted stock awards (4) 600 865 1,008
Other (9)(19) 58
(1) Net gains (losses) on these derivatives are recorded in mortgage banking income as they are used to mitigate the interest rate risk related to MSRs, interest rate lock commitments and mortgage
loans held-for-sale, all of which are measured at fair value with changes in fair value recorded in mortgage banking income. The net gains on interest rate lock commitments related to the origination
of mortgage loans that are held-for-sale, which are not included in the table but are considered derivative instruments, were $776 million, $927 million and $3.0 billion for 2014, 2013 and 2012,
respectively.
(2) Net gains (losses) on these derivatives are recorded in other income (loss).
(3) Primarily related to hedges of debt securities carried at fair value and hedges of foreign currency-denominated debt. Gains (losses) on these derivatives and the related hedged items are recorded
in other income (loss).
(4) Gains (losses) on these derivatives are recorded in personnel expense.
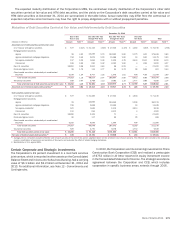
Sales and Trading Revenue
The Corporation enters into trading derivatives to facilitate client
transactions and to manage risk exposures arising from trading
account assets and liabilities. It is the Corporation’s policy to
include these derivative instruments in its trading activities which
include derivatives and non-derivative cash instruments. The
resulting risk from these derivatives is managed on a portfolio
basis as part of the Corporation’s Global Markets business
segment. The related sales and trading revenue generated within
Global Markets is recorded in various income statement line items
including trading account profits and net interest income as well
as other revenue categories. However, the majority of income
related to derivative instruments is recorded in trading account
profits.
Sales and trading revenue includes changes in the fair value
and realized gains and losses on the sales of trading and other
assets, net interest income, and fees primarily from commissions
on equity securities. Revenue is generated by the difference in the
client price for an instrument and the price at which the trading
desk can execute the trade in the dealer market. For equity
securities, commissions related to purchases and sales are
recorded in the “Other” column in the Sales and Trading Revenue
table. Changes in the fair value of these securities are included
in trading account profits. For debt securities, revenue, with the
exception of interest associated with the debt securities, is
typically included in trading account profits. Unlike commissions
for equity securities, the initial revenue related to broker-dealer
services for debt securities is typically included in the pricing of
the instrument rather than being charged through separate fee
arrangements. Therefore, this revenue is recorded in trading
account profits as part of the initial mark to fair value. For
derivatives, the majority of revenue is included in trading account
profits. In transactions where the Corporation acts as agent, which
include exchange-traded futures and options, fees are recorded in
other income (loss).
Gains (losses) on certain instruments, primarily loans, that the
Global Markets business segment shares with Global Banking are
not considered trading instruments and are excluded from sales
and trading revenue in their entirety.