Bank of America 2014 Annual Report Download - page 86
Download and view the complete annual report
Please find page 86 of the 2014 Bank of America annual report below. You can navigate through the pages in the report by either clicking on the pages listed below, or by using the keyword search tool below to find specific information within the annual report.-
 1
1 -
2
-
3
-
4
-
5
-
6
-
7
-
8
-
9
-
10
-
11
-
12
-
13
-
14
-
15
-
16
-
17
-
18
-
19
-
20
-
21
-
22
-
23
-
24
-
25
-
26
-
27
-
28
-
29
-
30
-
31
-
32
-
33
-
34
-
35
-
36
-
37
-
38
-
39
-
40
-
41
-
42
-
43
-
44
-
45
-
46
-
47
-
48
-
49
-
50
-
51
-
52
-
53
-
54
-
55
-
56
-
57
-
58
-
59
-
60
-
61
-
62
-
63
-
64
-
65
-
66
-
67
-
68
-
69
-
70
-
71
-
72
-
73
-
74
-
75
-
 76
76 -
 77
77 -
 78
78 -
 79
79 -
 80
80 -
 81
81 -
 82
82 -
 83
83 -
 84
84 -
 85
85 -
 86
86 -
 87
87 -
 88
88 -
 89
89 -
 90
90 -
 91
91 -
 92
92 -
 93
93 -
 94
94 -
 95
95 -
 96
96 -
97
-
98
-
99
-
100
-
101
-
102
-
103
-
104
-
105
-
106
-
107
-
108
-
109
-
110
-
111
-
112
-
113
-
114
-
115
-
116
-
117
-
118
-
119
-
120
-
121
-
122
-
123
-
124
-
125
-
126
-
127
-
128
-
129
-
130
-
131
-
132
-
133
-
134
-
135
-
136
-
137
-
138
-
139
-
140
-
141
-
142
-
143
-
144
-
145
-
146
-
147
-
148
-
149
-
150
-
151
-
152
-
153
-
154
-
155
-
156
-
157
-
158
-
159
-
160
-
161
-
162
-
163
-
164
-
165
-
166
-
167
-
168
-
169
-
170
-
171
-
172
-
173
-
174
-
175
-
176
-
177
-
178
-
179
-
180
-
181
-
182
-
183
-
184
-
185
-
186
-
187
-
188
-
189
-
190
-
191
-
192
-
193
-
194
-
195
-
196
-
197
-
198
-
199
-
200
-
201
-
202
-
203
-
204
-
205
-
206
-
207
-
208
-
209
-
210
-
211
-
212
-
213
-
214
-
215
-
216
-
217
-
218
-
219
-
220
-
221
-
222
-
223
-
224
-
225
-
226
-
227
-
228
-
229
-
230
-
231
-
232
-
233
-
234
-
235
-
236
-
237
-
238
-
239
-
240
-
241
-
242
-
243
-
244
-
245
-
246
-
247
-
248
-
249
-
250
-
251
-
252
-
253
-
254
-
255
-
256
-
257
-
258
-
259
-
260
-
261
-
262
-
263
-
264
-
265
-
266
-
267
-
268
-
269
-
270
-
271
-
272
 |
 |

84 Bank of America 2014
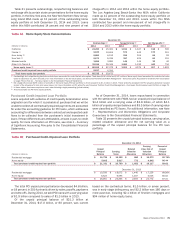
Commercial Real Estate
Commercial real estate primarily includes commercial loans and
leases secured by non-owner-occupied real estate and is
dependent on the sale or lease of the real estate as the primary
source of repayment. The portfolio remains diversified across
property types and geographic regions. California represented the
largest state concentration at 22 percent of the commercial real
estate loans and leases portfolio at both December 31, 2014 and
2013. The commercial real estate portfolio is predominantly
managed in Global Banking and consists of loans made primarily
to public and private developers, and commercial real estate firms.
Outstanding loans decreased $211 million during 2014 primarily
due to portfolio sales.
During 2014, we continued to see improvements in credit
quality in both the residential and non-residential portfolios. We
use a number of proactive risk mitigation initiatives to reduce
adversely rated exposure in the commercial real estate portfolio
including transfers of deteriorating exposures to management by
independent special asset officers and the pursuit of loan
restructurings or asset sales to achieve the best results for our
customers and the Corporation.
Nonperforming commercial real estate loans and foreclosed
properties decreased $24 million, or six percent, and reservable
criticized balances decreased $344 million, or 24 percent, in
2014. Net charge-offs declined $232 million to a net recovery of
$83 million in 2014.
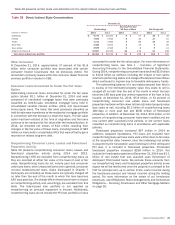
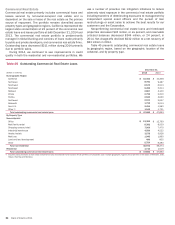
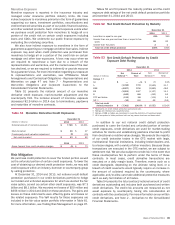
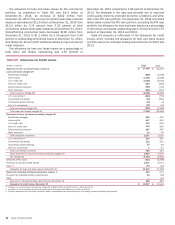
Table 45 presents outstanding commercial real estate loans
by geographic region, based on the geographic location of the
collateral, and by property type.
Table 45 Outstanding Commercial Real Estate Loans
December 31
(Dollars in millions) 2014 2013
By Geographic Region
California $10,352 $ 10,358
Northeast 8,781 9,487
Southwest 6,570 6,913
Southeast 5,495 5,314
Midwest 2,867 3,109
Illinois 2,785 2,319
Florida 2,520 3,030
Northwest 2,151 2,037
Midsouth 1,724 2,013
Non-U.S. 2,494 1,582
Other (1) 1,943 1,731
Total outstanding commercial real estate loans $ 47,682 $ 47,893
By Property Type
Non-residential
Office $13,306 $ 12,799
Multi-family rental 8,382 8,559
Shopping centers/retail 7,969 7,470
Industrial/warehouse 4,550 4,522
Hotels/motels 3,578 3,926
Multi-use 1,943 1,960
Land and land development 490 855
Other 5,754 6,283
Total non-residential 45,972 46,374
Residential 1,710 1,519
Total outstanding commercial real estate loans $ 47,682 $ 47,893
(1) Includes unsecured loans to real estate investment trusts and national home builders whose portfolios of properties span multiple geographic regions and properties in the states of Colorado, Utah,
Hawaii, Wyoming and Montana.