Bank of America 2014 Annual Report Download - page 204
Download and view the complete annual report
Please find page 204 of the 2014 Bank of America annual report below. You can navigate through the pages in the report by either clicking on the pages listed below, or by using the keyword search tool below to find specific information within the annual report.-
 1
1 -
2
-
3
-
4
-
5
-
6
-
7
-
8
-
9
-
10
-
11
-
12
-
13
-
14
-
15
-
16
-
17
-
18
-
19
-
20
-
21
-
22
-
23
-
24
-
25
-
26
-
27
-
28
-
29
-
30
-
31
-
32
-
33
-
34
-
35
-
36
-
37
-
38
-
39
-
40
-
41
-
42
-
43
-
44
-
45
-
46
-
47
-
48
-
49
-
50
-
51
-
52
-
53
-
54
-
55
-
56
-
57
-
58
-
59
-
60
-
61
-
62
-
63
-
64
-
65
-
66
-
67
-
68
-
69
-
70
-
71
-
72
-
73
-
74
-
75
-
76
-
77
-
78
-
79
-
80
-
81
-
82
-
83
-
84
-
85
-
86
-
87
-
88
-
89
-
90
-
91
-
92
-
93
-
94
-
95
-
96
-
97
-
98
-
99
-
100
-
101
-
102
-
103
-
104
-
105
-
106
-
107
-
108
-
109
-
110
-
111
-
112
-
113
-
114
-
115
-
116
-
117
-
118
-
119
-
120
-
121
-
122
-
123
-
124
-
125
-
126
-
127
-
128
-
129
-
130
-
131
-
132
-
133
-
134
-
135
-
136
-
137
-
138
-
139
-
140
-
141
-
142
-
143
-
144
-
145
-
146
-
147
-
148
-
149
-
150
-
151
-
152
-
153
-
154
-
155
-
156
-
157
-
158
-
159
-
160
-
161
-
162
-
163
-
164
-
165
-
166
-
167
-
168
-
169
-
170
-
171
-
172
-
173
-
174
-
175
-
176
-
177
-
178
-
179
-
180
-
181
-
182
-
183
-
184
-
185
-
186
-
187
-
188
-
189
-
190
-
191
-
192
-
193
-
 194
194 -
 195
195 -
 196
196 -
 197
197 -
 198
198 -
 199
199 -
 200
200 -
 201
201 -
 202
202 -
 203
203 -
 204
204 -
 205
205 -
 206
206 -
 207
207 -
 208
208 -
 209
209 -
 210
210 -
 211
211 -
 212
212 -
 213
213 -
 214
214 -
215
-
216
-
217
-
218
-
219
-
220
-
221
-
222
-
223
-
224
-
225
-
226
-
227
-
228
-
229
-
230
-
231
-
232
-
233
-
234
-
235
-
236
-
237
-
238
-
239
-
240
-
241
-
242
-
243
-
244
-
245
-
246
-
247
-
248
-
249
-
250
-
251
-
252
-
253
-
254
-
255
-
256
-
257
-
258
-
259
-
260
-
261
-
262
-
263
-
264
-
265
-
266
-
267
-
268
-
269
-
270
-
271
-
272
 |
 |

202 Bank of America 2014
Estimated Range of Possible Loss
The Corporation currently estimates that the range of possible
loss for representations and warranties exposures could be up to
$4 billion over existing accruals at December 31, 2014. The
estimated range of possible loss reflects principally non-GSE
exposures. It represents a reasonably possible loss, but does not
represent a probable loss, and is based on currently available
information, significant judgment and a number of assumptions
that are subject to change.
The liability for representations and warranties exposures and
the corresponding estimated range of possible loss do not
consider losses related to servicing (except as such losses are
included as potential costs of the BNY Mellon Settlement),
including foreclosure and related costs, fraud, indemnity, or claims
(including for RMBS) related to securities law or monoline
insurance litigations. Losses with respect to one or more of these
matters could be material to the Corporation’s results of
operations or cash flows for any particular reporting period.
Future provisions and/or ranges of possible loss for
representations and warranties may be significantly impacted if
actual experiences are different from the Corporation’s
assumptions in predictive models, including, without limitation,
ultimate resolution of the BNY Mellon Settlement, estimated
repurchase rates, estimated MI rescission rates, economic
conditions, estimated home prices, consumer and counterparty
behavior, the applicable statute of limitations and a variety of other
judgmental factors. Adverse developments with respect to one or
more of the assumptions underlying the liability for representations
and warranties and the corresponding estimated range of possible
loss could result in significant increases to future provisions and/
or the estimated range of possible loss. Finally, although the
Corporation believes that the representations and warranties
typically given in non-GSE transactions are less rigorous than those
given in GSE transactions, the Corporation does not have
significant experience resolving loan-level claims in non-GSE
transactions to measure the impact of these differences on the
probability that a loan will be required to be repurchased.
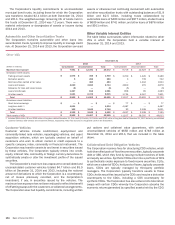
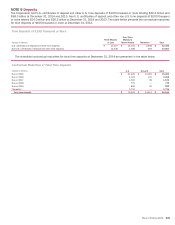
Cash Payments
The Loan Repurchases and Indemnification Payments table
presents first-lien and home equity loan repurchases and
indemnification payments made by the Corporation to reimburse
the investor or securitization trust for losses they incurred, and to
resolve repurchase claims. Cash paid for loan repurchases
includes the unpaid principal balance of the loan plus past due
interest. The amount of loss for loan repurchases is reduced by
the fair value of the underlying loan collateral. The repurchase of
loans and indemnification payments related to first-lien and home
equity repurchase claims generally resulted from material
breaches of representations and warranties related to the loans’
material compliance with the applicable underwriting standards,
including borrower misrepresentation, credit exceptions without
sufficient compensating factors and non-compliance with
underwriting procedures. The actual representations and
warranties made in a sales transaction and the resulting
repurchase and indemnification activity can vary by transaction or
investor. A direct relationship between the type of defect that
causes the breach of representations and warranties and the
severity of the realized loss has not been observed. Loan
repurchases or indemnification payments related to first-lien
residential mortgages primarily involved the GSEs while
repurchases or indemnification payments related to home equity
loans primarily involved the monoline insurers.
Loan Repurchases and Indemnification Payments (excluding cash payments for settlements)
December 31
2014 2013
(Dollars in millions)
Unpaid
Principal
Balance
Cash Paid
for
Repurchases Loss
Unpaid
Principal
Balance
Cash Paid
for
Repurchases Loss
First-lien
Repurchases $ 211 $ 241 $79
$ 746 $ 784 $ 149
Indemnification payments 624 233 233 661 383 383
Total first-lien 835 474 312 1,407 1,167 532
Home equity, indemnification payments 22 22 22 74 77 77
Total first-lien and home equity $ 857 $ 496 $334 $ 1,481 $ 1,244 $ 609
The amounts in the table above exclude payments made in
connection with the FHFA Settlement, the 2013 settlements with
FHLMC and FNMA, and amounts paid in monoline settlements
during 2014 and 2013, including payments made directly to
securitization trusts.