Bank of America 2014 Annual Report Download - page 236
Download and view the complete annual report
Please find page 236 of the 2014 Bank of America annual report below. You can navigate through the pages in the report by either clicking on the pages listed below, or by using the keyword search tool below to find specific information within the annual report.-
 1
1 -
2
-
3
-
4
-
5
-
6
-
7
-
8
-
9
-
10
-
11
-
12
-
13
-
14
-
15
-
16
-
17
-
18
-
19
-
20
-
21
-
22
-
23
-
24
-
25
-
26
-
27
-
28
-
29
-
30
-
31
-
32
-
33
-
34
-
35
-
36
-
37
-
38
-
39
-
40
-
41
-
42
-
43
-
44
-
45
-
46
-
47
-
48
-
49
-
50
-
51
-
52
-
53
-
54
-
55
-
56
-
57
-
58
-
59
-
60
-
61
-
62
-
63
-
64
-
65
-
66
-
67
-
68
-
69
-
70
-
71
-
72
-
73
-
74
-
75
-
76
-
77
-
78
-
79
-
80
-
81
-
82
-
83
-
84
-
85
-
86
-
87
-
88
-
89
-
90
-
91
-
92
-
93
-
94
-
95
-
96
-
97
-
98
-
99
-
100
-
101
-
102
-
103
-
104
-
105
-
106
-
107
-
108
-
109
-
110
-
111
-
112
-
113
-
114
-
115
-
116
-
117
-
118
-
119
-
120
-
121
-
122
-
123
-
124
-
125
-
126
-
127
-
128
-
129
-
130
-
131
-
132
-
133
-
134
-
135
-
136
-
137
-
138
-
139
-
140
-
141
-
142
-
143
-
144
-
145
-
146
-
147
-
148
-
149
-
150
-
151
-
152
-
153
-
154
-
155
-
156
-
157
-
158
-
159
-
160
-
161
-
162
-
163
-
164
-
165
-
166
-
167
-
168
-
169
-
170
-
171
-
172
-
173
-
174
-
175
-
176
-
177
-
178
-
179
-
180
-
181
-
182
-
183
-
184
-
185
-
186
-
187
-
188
-
189
-
190
-
191
-
192
-
193
-
194
-
195
-
196
-
197
-
198
-
199
-
200
-
201
-
202
-
203
-
204
-
205
-
206
-
207
-
208
-
209
-
210
-
211
-
212
-
213
-
214
-
215
-
216
-
217
-
218
-
219
-
220
-
221
-
222
-
223
-
224
-
225
-
 226
226 -
 227
227 -
 228
228 -
 229
229 -
 230
230 -
 231
231 -
 232
232 -
 233
233 -
 234
234 -
 235
235 -
 236
236 -
 237
237 -
 238
238 -
 239
239 -
 240
240 -
 241
241 -
 242
242 -
 243
243 -
 244
244 -
 245
245 -
 246
246 -
247
-
248
-
249
-
250
-
251
-
252
-
253
-
254
-
255
-
256
-
257
-
258
-
259
-
260
-
261
-
262
-
263
-
264
-
265
-
266
-
267
-
268
-
269
-
270
-
271
-
272
 |
 |

234 Bank of America 2014
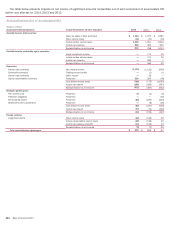
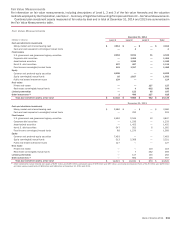
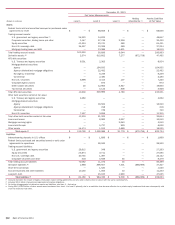
The Level 3 Fair Value Measurements table presents a reconciliation of all plan investment assets measured at fair value using
significant unobservable inputs (Level 3) during 2014, 2013 and 2012.
Level 3 Fair Value Measurements
2014
(Dollars in millions)
Balance
January 1
Actual Return on
Plan Assets Still
Held at the
Reporting Date Purchases
Sales and
Settlements
Transfers into/
(out of) Level 3
Balance
December 31
Fixed income
U.S. government and government agency securities $12$ —$—$(1)$—$11
Non-U.S. debt securities 6——(2)
(4)—
Real estate
Private real estate 119 5 5 (2) —127
Real estate commingled/mutual funds 462 20 150 ——632
Limited partnerships 145 5 3 (88) —65
Other investments 135 1 1 (10) —127
Total $ 879 $ 31 $ 159 $ (103) $ (4) $ 962
2013
Fixed income
U.S. government and government agency securities $ 13 $ — $ — $ (1) $ — $ 12
Non-U.S. debt securities 10 (2) — (2) — 6
Real estate
Private real estate 110 4 7 (2) — 119
Real estate commingled/mutual funds 324 15 123 — — 462
Limited partnerships 231 8 23 (89) (28) 145
Other investments 129 (6) 13 (1) — 135
Total $ 817 $ 19 $ 166 $ (95) $ (28) $ 879
2012
Fixed income
U.S. government and government agency securities $ 13 $ — $ — $ — $ — $ 13
Non-U.S. debt securities 10 (1) 1 (1) 1 10
Real estate
Private real estate 113 (2) 2 (3) — 110
Real estate commingled/mutual funds 249 13 62 — — 324
Limited partnerships 232 8 11 (20) — 231
Other investments 122 7 4 (4) — 129
Total $ 739 $ 25 $ 80 $ (28) $ 1 $ 817
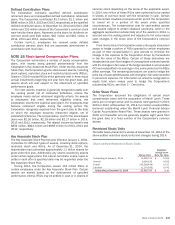
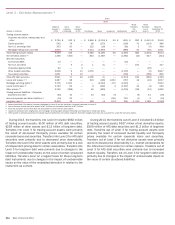
Projected Benefit Payments
Benefit payments projected to be made from the Qualified Pension Plan, Non-U.S. Pension Plans, Nonqualified and Other Pension Plans,
and Postretirement Health and Life Plans are presented in the table below.
Projected Benefit Payments
Postretirement Health and Life Plans
(Dollars in millions)
Qualified
Pension Plan (1)
Non-U.S.
Pension Plans (2)
Nonqualified
and Other
Pension Plans (2) Net Payments (3)
Medicare
Subsidy
2015 $ 921 $ 55 $ 244 $ 130 $ 14
2016 908 58 241 126 14
2017 900 62 242 122 14
2018 899 65 239 117 13
2019 895 72 236 111 13
2020 – 2024 4,407 449 1,136 495 58
(1) Benefit payments expected to be made from the plan’s assets.
(2) Benefit payments expected to be made from a combination of the plans’ and the Corporation’s assets.
(3) Benefit payments (net of retiree contributions) expected to be made from a combination of the plans’ and the Corporation’s assets.