Bank of America 2014 Annual Report Download - page 170
Download and view the complete annual report
Please find page 170 of the 2014 Bank of America annual report below. You can navigate through the pages in the report by either clicking on the pages listed below, or by using the keyword search tool below to find specific information within the annual report.-
 1
1 -
2
-
3
-
4
-
5
-
6
-
7
-
8
-
9
-
10
-
11
-
12
-
13
-
14
-
15
-
16
-
17
-
18
-
19
-
20
-
21
-
22
-
23
-
24
-
25
-
26
-
27
-
28
-
29
-
30
-
31
-
32
-
33
-
34
-
35
-
36
-
37
-
38
-
39
-
40
-
41
-
42
-
43
-
44
-
45
-
46
-
47
-
48
-
49
-
50
-
51
-
52
-
53
-
54
-
55
-
56
-
57
-
58
-
59
-
60
-
61
-
62
-
63
-
64
-
65
-
66
-
67
-
68
-
69
-
70
-
71
-
72
-
73
-
74
-
75
-
76
-
77
-
78
-
79
-
80
-
81
-
82
-
83
-
84
-
85
-
86
-
87
-
88
-
89
-
90
-
91
-
92
-
93
-
94
-
95
-
96
-
97
-
98
-
99
-
100
-
101
-
102
-
103
-
104
-
105
-
106
-
107
-
108
-
109
-
110
-
111
-
112
-
113
-
114
-
115
-
116
-
117
-
118
-
119
-
120
-
121
-
122
-
123
-
124
-
125
-
126
-
127
-
128
-
129
-
130
-
131
-
132
-
133
-
134
-
135
-
136
-
137
-
138
-
139
-
140
-
141
-
142
-
143
-
144
-
145
-
146
-
147
-
148
-
149
-
150
-
151
-
152
-
153
-
154
-
155
-
156
-
157
-
158
-
159
-
 160
160 -
 161
161 -
 162
162 -
 163
163 -
 164
164 -
 165
165 -
 166
166 -
 167
167 -
 168
168 -
 169
169 -
 170
170 -
 171
171 -
 172
172 -
 173
173 -
 174
174 -
 175
175 -
 176
176 -
 177
177 -
 178
178 -
 179
179 -
 180
180 -
181
-
182
-
183
-
184
-
185
-
186
-
187
-
188
-
189
-
190
-
191
-
192
-
193
-
194
-
195
-
196
-
197
-
198
-
199
-
200
-
201
-
202
-
203
-
204
-
205
-
206
-
207
-
208
-
209
-
210
-
211
-
212
-
213
-
214
-
215
-
216
-
217
-
218
-
219
-
220
-
221
-
222
-
223
-
224
-
225
-
226
-
227
-
228
-
229
-
230
-
231
-
232
-
233
-
234
-
235
-
236
-
237
-
238
-
239
-
240
-
241
-
242
-
243
-
244
-
245
-
246
-
247
-
248
-
249
-
250
-
251
-
252
-
253
-
254
-
255
-
256
-
257
-
258
-
259
-
260
-
261
-
262
-
263
-
264
-
265
-
266
-
267
-
268
-
269
-
270
-
271
-
272
 |
 |

168 Bank of America 2014
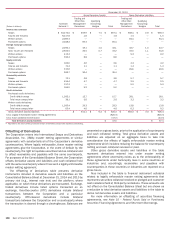
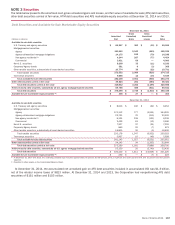
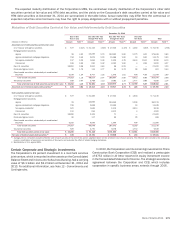
The table below presents the components of other debt
securities carried at fair value where the changes in fair value are
reported in other income. In 2014, the Corporation recorded
unrealized mark-to-market net gains in other income of $1.2 billion
and realized gains of $275 million on other debt securities carried
at fair value, which exclude the impact of certain hedges, the
results of which are also reported in other income, compared to
unrealized mark-to-market net losses of $1.3 billion and realized
losses of $963 million in 2013.
Other Debt Securities Carried at Fair Value
December 31
(Dollars in millions) 2014 2013
U.S. Treasury and agency securities $ 1,541 $ 4,062
Mortgage-backed securities:
Agency 15,704 16,500
Agency-collateralized mortgage obligations —218
Non-agency residential 3,745 —
Commercial —749
Non-U.S. securities (1) 15,132 11,315
Other taxable securities, substantially all
asset-backed securities 299 —
Total $ 36,421 $ 32,844
(1) These securities are primarily used to satisfy certain international regulatory liquidity
requirements.
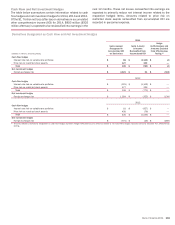
The table below presents gross realized gains and losses on
sales of AFS debt securities for 2014, 2013 and 2012.
Gains and Losses on Sales of AFS Debt Securities
(Dollars in millions) 2014 2013 2012
Gross gains $ 1,366 $ 1,302 $ 2,128
Gross losses (12) (31) (466)
Net gains on sales of AFS debt securities $ 1,354 $ 1,271 $ 1,662
Income tax expense attributable to realized
net gains on sales of AFS debt securities $ 515 $ 470 $ 615
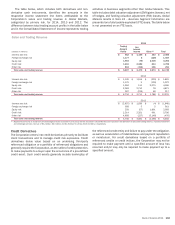
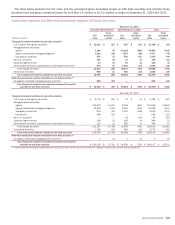
The table below presents the amortized cost and fair value of
the Corporation’s debt securities carried at fair value and HTM
debt securities from Fannie Mae (FNMA), the Government National
Mortgage Association (GNMA), U.S. Treasury and Freddie Mac
(FHLMC), where the investment exceeded 10 percent of
consolidated shareholders’ equity at December 31, 2014 and
2013.
Selected Securities Exceeding 10 Percent of
Shareholders’ Equity
December 31
2014 2013
(Dollars in millions)
Amortized
Cost
Fair
Value
Amortized
Cost
Fair
Value
Fannie Mae $ 130,725 $ 131,418 $ 123,813 $ 118,708
Government National
Mortgage Association 98,278 98,633 118,700 115,314
U.S. Treasury 68,481 68,801 10,533 10,428
Freddie Mac 28,288 28,556 24,908 24,075