Bank of America 2014 Annual Report Download - page 245
Download and view the complete annual report
Please find page 245 of the 2014 Bank of America annual report below. You can navigate through the pages in the report by either clicking on the pages listed below, or by using the keyword search tool below to find specific information within the annual report.-
 1
1 -
2
-
3
-
4
-
5
-
6
-
7
-
8
-
9
-
10
-
11
-
12
-
13
-
14
-
15
-
16
-
17
-
18
-
19
-
20
-
21
-
22
-
23
-
24
-
25
-
26
-
27
-
28
-
29
-
30
-
31
-
32
-
33
-
34
-
35
-
36
-
37
-
38
-
39
-
40
-
41
-
42
-
43
-
44
-
45
-
46
-
47
-
48
-
49
-
50
-
51
-
52
-
53
-
54
-
55
-
56
-
57
-
58
-
59
-
60
-
61
-
62
-
63
-
64
-
65
-
66
-
67
-
68
-
69
-
70
-
71
-
72
-
73
-
74
-
75
-
76
-
77
-
78
-
79
-
80
-
81
-
82
-
83
-
84
-
85
-
86
-
87
-
88
-
89
-
90
-
91
-
92
-
93
-
94
-
95
-
96
-
97
-
98
-
99
-
100
-
101
-
102
-
103
-
104
-
105
-
106
-
107
-
108
-
109
-
110
-
111
-
112
-
113
-
114
-
115
-
116
-
117
-
118
-
119
-
120
-
121
-
122
-
123
-
124
-
125
-
126
-
127
-
128
-
129
-
130
-
131
-
132
-
133
-
134
-
135
-
136
-
137
-
138
-
139
-
140
-
141
-
142
-
143
-
144
-
145
-
146
-
147
-
148
-
149
-
150
-
151
-
152
-
153
-
154
-
155
-
156
-
157
-
158
-
159
-
160
-
161
-
162
-
163
-
164
-
165
-
166
-
167
-
168
-
169
-
170
-
171
-
172
-
173
-
174
-
175
-
176
-
177
-
178
-
179
-
180
-
181
-
182
-
183
-
184
-
185
-
186
-
187
-
188
-
189
-
190
-
191
-
192
-
193
-
194
-
195
-
196
-
197
-
198
-
199
-
200
-
201
-
202
-
203
-
204
-
205
-
206
-
207
-
208
-
209
-
210
-
211
-
212
-
213
-
214
-
215
-
216
-
217
-
218
-
219
-
220
-
221
-
222
-
223
-
224
-
225
-
226
-
227
-
228
-
229
-
230
-
231
-
232
-
233
-
234
-
 235
235 -
 236
236 -
 237
237 -
 238
238 -
 239
239 -
 240
240 -
 241
241 -
 242
242 -
 243
243 -
 244
244 -
 245
245 -
 246
246 -
 247
247 -
 248
248 -
 249
249 -
 250
250 -
 251
251 -
 252
252 -
 253
253 -
 254
254 -
 255
255 -
256
-
257
-
258
-
259
-
260
-
261
-
262
-
263
-
264
-
265
-
266
-
267
-
268
-
269
-
270
-
271
-
272
 |
 |

Bank of America 2014 243
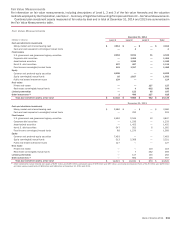
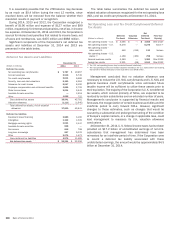
The following tables present a reconciliation of all assets and liabilities measured at fair value on a recurring basis using significant
unobservable inputs (Level 3) during 2014, 2013 and 2012, including net realized and unrealized gains (losses) included in earnings
and accumulated OCI.
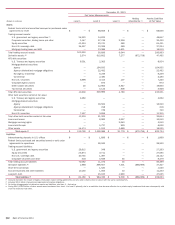
Level 3 – Fair Value Measurements (1)
2014
Gross
(Dollars in millions)
Balance
January 1
2014
Gains
(Losses)
in Earnings
Gains
(Losses)
in OCI Purchases Sales Issuances Settlements
Gross
Transfers
into
Level 3
Gross
Transfers
out of
Level 3
Balance
December 31
2014
Trading account assets:
U.S. government and agency securities $—$ —$—$87$(87)$ —$ —$ —$—$—
Corporate securities, trading loans and
other 3,559 180 — 1,675 (857) — (938) 1,275 (1,624) 3,270
Equity securities 386 — — 104 (86) — (16) 146 (182) 352
Non-U.S. sovereign debt 468 30 — 120 (34) — (19) 11 (2) 574
Mortgage trading loans and ABS 4,631 199 — 1,643 (1,259) — (585) 39 (2,605) 2,063
Total trading account assets 9,044 409 — 3,629 (2,323)—
(1,558) 1,471 (4,413) 6,259
Net derivative assets (2) (224) 463 — 823 (1,738) — (432) 28 160 (920)
AFS debt securities:
Non-agency residential MBS —(2)—11—— —
270 — 279
Non-U.S. securities 107 (7) (11) 241 — — (147) — (173)10
Corporate/Agency bonds — ————— —93 (93) —
Other taxable securities 3,847 9 (8) 154 ——
(1,381)— (954) 1,667
Tax-exempt securities 806 8 — — (16) — (235) 36 — 599
Total AFS debt securities 4,760 8 (19) 406 (16) — (1,763)399 (1,220) 2,555
Loans and leases (3, 4) 3,057 69 — — (3) 699 (1,591)25 (273) 1,983
Mortgage servicing rights (4) 5,042 (1,231) — — (61) 707 (927) ——
3,530
Loans held-for-sale (3) 929 45 — 59 (725) 23 (216) 83 (25) 173
Other assets (5) 1,669 (98) — — (430) — (245) 39 (24) 911
Trading account liabilities – Corporate
securities and other (35) 1 — 10 (13) — — (9)10 (36)
Accrued expenses and other liabilities (3) (10) 2 — — — (3) — —1(10)
Long-term debt (3) (1,990) 49 — 169 — (615) 540 (1,581) 1,066 (2,362)
(1) Assets (liabilities). For assets, increase (decrease) to Level 3 and for liabilities, (increase) decrease to Level 3.
(2) Net derivatives include derivative assets of $6.9 billion and derivative liabilities of $7.8 billion.
(3) Amounts represent instruments that are accounted for under the fair value option.
(4) Issuances represent loan originations and mortgage servicing rights retained following securitizations or whole-loan sales.
(5) Other assets is primarily comprised of private equity investments and certain long-term fixed-rate margin loans that are accounted for under the fair value option.
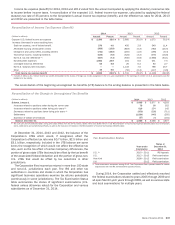
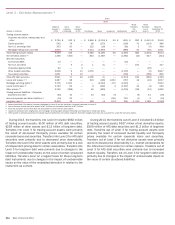
During 2014, the transfers into Level 3 included $1.5 billion of
trading account assets, $399 million of AFS debt securities and
$1.6 billion of long-term debt. Transfers into Level 3 for trading
account assets were primarily the result of decreased availability
of third-party prices for certain corporate loans and securities.
Transfers into Level 3 for AFS debt securities were primarily due
to decreased price observability related to municipal auction rate
securities (ARS). Transfers into Level 3 for long-term debt were
primarily due to changes in the impact of unobservable inputs on
the value of certain structured liabilities. Transfers occur on a
regular basis for these long-term debt instruments due to changes
in the impact of unobservable inputs on the value of the embedded
derivative in relation to the instrument as a whole.
During 2014, the transfers out of Level 3 included $4.4 billion
of trading account assets, $160 million of net derivative assets,
$1.2 billion of AFS debt securities, $273 million of loans and
leases and $1.1 billion of long-term debt. Transfers out of Level
3 for trading account assets were primarily the result of increased
market liquidity and price observability on certain CLOs. Transfers
out of Level 3 for net derivative assets were primarily due to
increased price observability for certain equity derivatives.
Transfers out of Level 3 for AFS debt securities were primarily due
to increased price observability on certain CLOs. Transfers out of
Level 3 for loans and leases were primarily due to increased price
observability. Transfers out of Level 3 for long-term debt were
primarily due to changes in the impact of unobservable inputs on
the value of certain structured liabilities.