Bank of America 2014 Annual Report Download - page 75
Download and view the complete annual report
Please find page 75 of the 2014 Bank of America annual report below. You can navigate through the pages in the report by either clicking on the pages listed below, or by using the keyword search tool below to find specific information within the annual report.-
 1
1 -
2
-
3
-
4
-
5
-
6
-
7
-
8
-
9
-
10
-
11
-
12
-
13
-
14
-
15
-
16
-
17
-
18
-
19
-
20
-
21
-
22
-
23
-
24
-
25
-
26
-
27
-
28
-
29
-
30
-
31
-
32
-
33
-
34
-
35
-
36
-
37
-
38
-
39
-
40
-
41
-
42
-
43
-
44
-
45
-
46
-
47
-
48
-
49
-
50
-
51
-
52
-
53
-
54
-
55
-
56
-
57
-
58
-
59
-
60
-
61
-
62
-
63
-
64
-
 65
65 -
 66
66 -
 67
67 -
 68
68 -
 69
69 -
 70
70 -
 71
71 -
 72
72 -
 73
73 -
 74
74 -
 75
75 -
 76
76 -
 77
77 -
 78
78 -
 79
79 -
 80
80 -
 81
81 -
 82
82 -
 83
83 -
 84
84 -
 85
85 -
86
-
87
-
88
-
89
-
90
-
91
-
92
-
93
-
94
-
95
-
96
-
97
-
98
-
99
-
100
-
101
-
102
-
103
-
104
-
105
-
106
-
107
-
108
-
109
-
110
-
111
-
112
-
113
-
114
-
115
-
116
-
117
-
118
-
119
-
120
-
121
-
122
-
123
-
124
-
125
-
126
-
127
-
128
-
129
-
130
-
131
-
132
-
133
-
134
-
135
-
136
-
137
-
138
-
139
-
140
-
141
-
142
-
143
-
144
-
145
-
146
-
147
-
148
-
149
-
150
-
151
-
152
-
153
-
154
-
155
-
156
-
157
-
158
-
159
-
160
-
161
-
162
-
163
-
164
-
165
-
166
-
167
-
168
-
169
-
170
-
171
-
172
-
173
-
174
-
175
-
176
-
177
-
178
-
179
-
180
-
181
-
182
-
183
-
184
-
185
-
186
-
187
-
188
-
189
-
190
-
191
-
192
-
193
-
194
-
195
-
196
-
197
-
198
-
199
-
200
-
201
-
202
-
203
-
204
-
205
-
206
-
207
-
208
-
209
-
210
-
211
-
212
-
213
-
214
-
215
-
216
-
217
-
218
-
219
-
220
-
221
-
222
-
223
-
224
-
225
-
226
-
227
-
228
-
229
-
230
-
231
-
232
-
233
-
234
-
235
-
236
-
237
-
238
-
239
-
240
-
241
-
242
-
243
-
244
-
245
-
246
-
247
-
248
-
249
-
250
-
251
-
252
-
253
-
254
-
255
-
256
-
257
-
258
-
259
-
260
-
261
-
262
-
263
-
264
-
265
-
266
-
267
-
268
-
269
-
270
-
271
-
272
 |
 |

Bank of America 2014 73
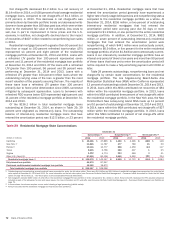
The Community Reinvestment Act (CRA) encourages banks to
meet the credit needs of their communities for housing and other
purposes, particularly in neighborhoods with low or moderate
incomes. Our CRA portfolio was $9.0 billion and $10.3 billion at
December 31, 2014 and 2013, or seven percent of the residential
mortgage portfolio, at both December 31, 2014 and 2013. The
CRA portfolio included $986 million and $1.7 billion of
nonperforming loans at December 31, 2014 and 2013,
representing 14 percent of total nonperforming residential
mortgage loans, at both December 31, 2014 and 2013. Net
charge-offs in the CRA portfolio were $52 million compared to net
recoveries of $114 million for the residential mortgage portfolio
in 2014 and $260 million of the $1.1 billion total net charge-offs
for the residential mortgage portfolio in 2013.
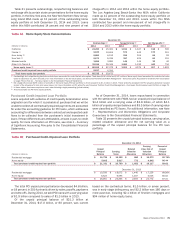
Home Equity
At December 31, 2014, the home equity portfolio made up 18
percent of the consumer portfolio and is comprised of HELOCs,
home equity loans and reverse mortgages.
At December 31, 2014, our HELOC portfolio had an
outstanding balance of $74.2 billion, or 87 percent of the total
home equity portfolio compared to $80.3 billion, or 86 percent,
at December 31, 2013. HELOCs generally have an initial draw
period of 10 years. During the initial draw period, the borrowers
are only required to pay the interest due on the loans on a monthly
basis. After the initial draw period ends, the loans generally convert
to 15-year amortizing loans.
At December 31, 2014, our home equity loan portfolio had an
outstanding balance of $9.8 billion, or 11 percent of the total home
equity portfolio compared to $12.0 billion, or 13 percent, at
December 31, 2013. Home equity loans are almost all fixed-rate
loans with amortizing payment terms of 10 to 30 years and of the
$9.8 billion at December 31, 2014, 53 percent have 25- to 30-
year terms. At December 31, 2014, our reverse mortgage portfolio
had an outstanding balance, excluding loans accounted for under
the fair value option, of $1.7 billion, or two percent of the total
home equity portfolio compared to $1.4 billion, or one percent, at
December 31, 2013. We no longer originate reverse mortgages.
At December 31, 2014, approximately 90 percent of the home
equity portfolio was included in CRES while the remainder of the
portfolio was primarily in GWIM. Outstanding balances in the home
equity portfolio, excluding loans accounted for under the fair value
option, decreased $7.9 billion in 2014 primarily due to paydowns
and charge-offs outpacing new originations and draws on existing
lines. Of the total home equity portfolio at December 31, 2014
and 2013, $20.6 billion and $20.7 billion, or 24 percent and 22
percent, were in first-lien positions (26 percent and 24 percent
excluding the PCI home equity portfolio). At December 31, 2014,
outstanding balances in the home equity portfolio that were in a
second-lien or more junior-lien position and where we also held
the first-lien loan totaled $15.4 billion, or 19 percent of our total
home equity portfolio excluding the PCI loan portfolio.
Unused HELOCs totaled $53.7 billion and $56.8 billion at
December 31, 2014 and 2013. The decrease was primarily due
to customers choosing to close accounts, which more than offset
customer paydowns of principal balances, as well as the impact
of new production. The HELOC utilization rate was 58 percent and
59 percent at December 31, 2014 and 2013.
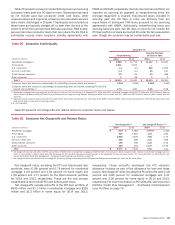
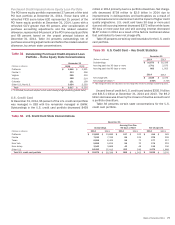
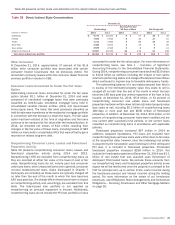
Table 30 presents certain home equity portfolio key credit
statistics on both a reported basis excluding loans accounted for
under the fair value option, and excluding the PCI loan portfolio
and loans accounted for under the fair value option. Additionally,
in the “Reported Basis” columns in the table below, accruing
balances past due 30 days or more and nonperforming loans do
not include the PCI loan portfolio, in accordance with our
accounting policies, even though the customer may be
contractually past due. As such, the following discussion presents
the home equity portfolio excluding the PCI loan portfolio and loans
accounted for under the fair value option. For more information on
the PCI loan portfolio, see page 75.
Table 30 Home Equity – Key Credit Statistics
December 31
Reported Basis (1)
Excluding Purchased
Credit-impaired Loans
(Dollars in millions) 2014 2013 2014 2013
Outstandings $ 85,725 $ 93,672 $80,108 $ 87,079
Accruing past due 30 days or more (2) 640 901 640 901
Nonperforming loans (2) 3,901 4,075 3,901 4,075
Percent of portfolio
Refreshed CLTV greater than 90 but less than or equal to 100 (3) 8% 9% 7% 8%
Refreshed CLTV greater than 100 (3) 16 23 14 21
Refreshed FICO below 620 8878
2006 and 2007 vintages (4) 46 48 43 45
Net charge-off ratio (5) 1.01 1.80 1.09 1.94
(1) Outstandings, accruing past due, nonperforming loans and percentages of the portfolio exclude loans accounted for under the fair value option. There were $196 million and $147 million of home
equity loans accounted for under the fair value option at December 31, 2014 and 2013. For more information on the fair value option, see Consumer Portfolio Credit Risk Management – Consumer
Loans Accounted for Under the Fair Value Option on page 79 and Note 21 – Fair Value Option to the Consolidated Financial Statements.
(2) Accruing past due 30 days or more includes $98 million and $131 million and nonperforming loans includes $505 million and $582 million of loans where we serviced the underlying first-lien at
December 31, 2014 and 2013.
(3) Effective December 31, 2014, with the exception of high-value properties, underlying values for LTV ratios are primarily determined using automated valuation models. For high-value properties,
generally with an original value of $1 million or more, estimated property values are determined using the CoreLogic Case-Shiller Index. Prior-period values have been updated to reflect this change.
Previously reported values were primarily determined through an index-based approach.
(4) These vintages of loans have higher refreshed combined LTV ratios and accounted for 47 percent and 50 percent of nonperforming home equity loans at December 31, 2014 and 2013, and 59
percent and 63 percent of net charge-offs in 2014 and 2013.
(5) Net charge-off ratios are calculated as net charge-offs divided by average outstanding loans excluding loans accounted for under the fair value option.