Bank of America 2014 Annual Report Download - page 87
Download and view the complete annual report
Please find page 87 of the 2014 Bank of America annual report below. You can navigate through the pages in the report by either clicking on the pages listed below, or by using the keyword search tool below to find specific information within the annual report.-
 1
1 -
2
-
3
-
4
-
5
-
6
-
7
-
8
-
9
-
10
-
11
-
12
-
13
-
14
-
15
-
16
-
17
-
18
-
19
-
20
-
21
-
22
-
23
-
24
-
25
-
26
-
27
-
28
-
29
-
30
-
31
-
32
-
33
-
34
-
35
-
36
-
37
-
38
-
39
-
40
-
41
-
42
-
43
-
44
-
45
-
46
-
47
-
48
-
49
-
50
-
51
-
52
-
53
-
54
-
55
-
56
-
57
-
58
-
59
-
60
-
61
-
62
-
63
-
64
-
65
-
66
-
67
-
68
-
69
-
70
-
71
-
72
-
73
-
74
-
75
-
76
-
 77
77 -
 78
78 -
 79
79 -
 80
80 -
 81
81 -
 82
82 -
 83
83 -
 84
84 -
 85
85 -
 86
86 -
 87
87 -
 88
88 -
 89
89 -
 90
90 -
 91
91 -
 92
92 -
 93
93 -
 94
94 -
 95
95 -
 96
96 -
 97
97 -
98
-
99
-
100
-
101
-
102
-
103
-
104
-
105
-
106
-
107
-
108
-
109
-
110
-
111
-
112
-
113
-
114
-
115
-
116
-
117
-
118
-
119
-
120
-
121
-
122
-
123
-
124
-
125
-
126
-
127
-
128
-
129
-
130
-
131
-
132
-
133
-
134
-
135
-
136
-
137
-
138
-
139
-
140
-
141
-
142
-
143
-
144
-
145
-
146
-
147
-
148
-
149
-
150
-
151
-
152
-
153
-
154
-
155
-
156
-
157
-
158
-
159
-
160
-
161
-
162
-
163
-
164
-
165
-
166
-
167
-
168
-
169
-
170
-
171
-
172
-
173
-
174
-
175
-
176
-
177
-
178
-
179
-
180
-
181
-
182
-
183
-
184
-
185
-
186
-
187
-
188
-
189
-
190
-
191
-
192
-
193
-
194
-
195
-
196
-
197
-
198
-
199
-
200
-
201
-
202
-
203
-
204
-
205
-
206
-
207
-
208
-
209
-
210
-
211
-
212
-
213
-
214
-
215
-
216
-
217
-
218
-
219
-
220
-
221
-
222
-
223
-
224
-
225
-
226
-
227
-
228
-
229
-
230
-
231
-
232
-
233
-
234
-
235
-
236
-
237
-
238
-
239
-
240
-
241
-
242
-
243
-
244
-
245
-
246
-
247
-
248
-
249
-
250
-
251
-
252
-
253
-
254
-
255
-
256
-
257
-
258
-
259
-
260
-
261
-
262
-
263
-
264
-
265
-
266
-
267
-
268
-
269
-
270
-
271
-
272
 |
 |

Bank of America 2014 85
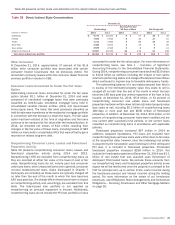
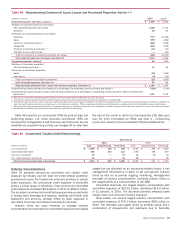
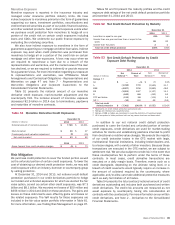
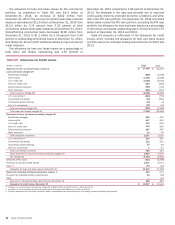
Tables 46 and 47 present commercial real estate credit quality
data by non-residential and residential property types. The
residential portfolio presented in Tables 45, 46 and 47 includes
condominiums and other residential real estate. Other property
types in Tables 45, 46 and 47 primarily include special purpose,
nursing/retirement homes, medical facilities and restaurants, as
well as unsecured loans to borrowers whose primary business is
commercial real estate.
Table 46 Commercial Real Estate Credit Quality Data
December 31
Nonperforming Loans and
Foreclosed Properties (1)
Utilized Reservable
Criticized Exposure (2)
(Dollars in millions) 2014 2013 2014 2013
Non-residential
Office $177 $96
$235 $ 367
Multi-family rental 21 15 125 234
Shopping centers/retail 46 57 350 144
Industrial/warehouse 42 22 67 119
Hotels/motels 3526 38
Multi-use 11 19 55 157
Land and land development 51 73 63 92
Other 15 23 159 173
Total non-residential 366 310 1,080 1,324
Residential 22 102 28 128
Total commercial real estate $ 388 $ 412 $ 1,108 $ 1,452
(1) Includes commercial foreclosed properties of $67 million and $90 million at December 31, 2014 and 2013.
(2) Includes loans, SBLCs and bankers’ acceptances and excludes loans accounted for under the fair value option.
Table 47 Commercial Real Estate Net Charge-offs and Related Ratios
Net Charge-offs Net Charge-off Ratios (1)
(Dollars in millions) 2014 2013 2014 2013
Non-residential
Office $(4)
$42(0.04)% 0.39%
Multi-family rental (22) 2(0.25) 0.02
Shopping centers/retail 412 0.06 0.18
Industrial/warehouse (1) 23 (0.03) 0.55
Hotels/motels (3) 18 (0.07) 0.52
Multi-use (9) 5(0.49) 0.26
Land and land development (2) 23 (0.31) 2.35
Other (38) (23) (0.64) (0.41)
Total non-residential (75) 102 (0.16) 0.25
Residential (8) 47 (0.47) 3.04
Total commercial real estate $(83)
$ 149 (0.18) 0.35
(1) Net charge-off ratios are calculated as net charge-offs divided by average outstanding loans excluding loans accounted for under the fair value option.
At December 31, 2014, total committed non-residential
exposure was $67.7 billion compared to $68.6 billion at
December 31, 2013, of which $46.0 billion and $46.4 billion were
funded secured loans. Non-residential nonperforming loans and
foreclosed properties increased $56 million, or 18 percent, to
$366 million at December 31, 2014 compared to December 31,
2013, which represented 0.79 percent and 0.67 percent of total
non-residential loans and foreclosed properties. The increase in
nonperforming loans and foreclosed properties in the non-
residential portfolio was primarily in the office property type. Non-
residential utilized reservable criticized exposure decreased $244
million, or 18 percent, to $1.1 billion at December 31, 2014
compared to December 31, 2013, which represented 2.27 percent
and 2.75 percent of non-residential utilized reservable exposure.
For the non-residential portfolio, net charge-offs decreased $177
million to a net recovery of $75 million in 2014 primarily due to
lower levels of criticized and nonperforming assets as well as
recoveries of prior-period charge-offs.
At December 31, 2014, total committed residential exposure
was $3.6 billion compared to $3.1 billion at December 31, 2013,
of which $1.7 billion and $1.5 billion were funded secured loans.
In 2014, residential nonperforming loans and foreclosed
properties decreased $80 million, or 78 percent, and residential
utilized reservable criticized exposure decreased $100 million, or
78 percent, due to repayments, sales and loan restructurings. The
nonperforming loans, leases and foreclosed properties and the
utilized reservable criticized ratios for the residential portfolio were
1.28 percent and 1.51 percent at December 31, 2014 compared
to 6.65 percent and 7.81 percent at December 31, 2013.
Residential portfolio net charge-offs decreased $55 million to a
net recovery of $8 million in 2014.
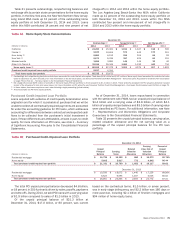
At December 31, 2014 and 2013, the commercial real estate
loan portfolio included $6.7 billion and $7.0 billion of funded
construction and land development loans that were originated to
fund the construction and/or rehabilitation of commercial
properties. Reservable criticized construction and land