Bank of America 2014 Annual Report Download - page 129
Download and view the complete annual report
Please find page 129 of the 2014 Bank of America annual report below. You can navigate through the pages in the report by either clicking on the pages listed below, or by using the keyword search tool below to find specific information within the annual report.-
 1
1 -
2
-
3
-
4
-
5
-
6
-
7
-
8
-
9
-
10
-
11
-
12
-
13
-
14
-
15
-
16
-
17
-
18
-
19
-
20
-
21
-
22
-
23
-
24
-
25
-
26
-
27
-
28
-
29
-
30
-
31
-
32
-
33
-
34
-
35
-
36
-
37
-
38
-
39
-
40
-
41
-
42
-
43
-
44
-
45
-
46
-
47
-
48
-
49
-
50
-
51
-
52
-
53
-
54
-
55
-
56
-
57
-
58
-
59
-
60
-
61
-
62
-
63
-
64
-
65
-
66
-
67
-
68
-
69
-
70
-
71
-
72
-
73
-
74
-
75
-
76
-
77
-
78
-
79
-
80
-
81
-
82
-
83
-
84
-
85
-
86
-
87
-
88
-
89
-
90
-
91
-
92
-
93
-
94
-
95
-
96
-
97
-
98
-
99
-
100
-
101
-
102
-
103
-
104
-
105
-
106
-
107
-
108
-
109
-
110
-
111
-
112
-
113
-
114
-
115
-
116
-
117
-
118
-
 119
119 -
 120
120 -
 121
121 -
 122
122 -
 123
123 -
 124
124 -
 125
125 -
 126
126 -
 127
127 -
 128
128 -
 129
129 -
 130
130 -
 131
131 -
 132
132 -
 133
133 -
 134
134 -
 135
135 -
 136
136 -
 137
137 -
 138
138 -
 139
139 -
140
-
141
-
142
-
143
-
144
-
145
-
146
-
147
-
148
-
149
-
150
-
151
-
152
-
153
-
154
-
155
-
156
-
157
-
158
-
159
-
160
-
161
-
162
-
163
-
164
-
165
-
166
-
167
-
168
-
169
-
170
-
171
-
172
-
173
-
174
-
175
-
176
-
177
-
178
-
179
-
180
-
181
-
182
-
183
-
184
-
185
-
186
-
187
-
188
-
189
-
190
-
191
-
192
-
193
-
194
-
195
-
196
-
197
-
198
-
199
-
200
-
201
-
202
-
203
-
204
-
205
-
206
-
207
-
208
-
209
-
210
-
211
-
212
-
213
-
214
-
215
-
216
-
217
-
218
-
219
-
220
-
221
-
222
-
223
-
224
-
225
-
226
-
227
-
228
-
229
-
230
-
231
-
232
-
233
-
234
-
235
-
236
-
237
-
238
-
239
-
240
-
241
-
242
-
243
-
244
-
245
-
246
-
247
-
248
-
249
-
250
-
251
-
252
-
253
-
254
-
255
-
256
-
257
-
258
-
259
-
260
-
261
-
262
-
263
-
264
-
265
-
266
-
267
-
268
-
269
-
270
-
271
-
272
 |
 |

Bank of America 2014 127
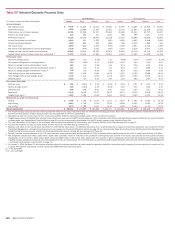
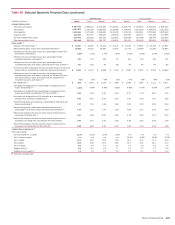
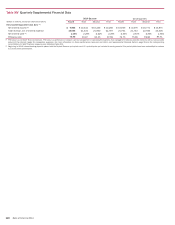
Table XII Selected Quarterly Financial Data (continued)
2014 Quarters 2013 Quarters
(Dollars in millions) Fourth Third Second First Fourth Third Second First
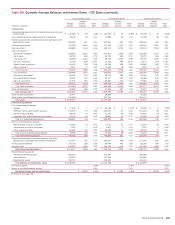
Average balance sheet
Total loans and leases $ 884,733 $ 899,241 $ 912,580 $ 919,482 $ 929,777 $ 923,978 $ 914,234 $ 906,259
Total assets 2,137,551 2,136,109 2,169,555 2,139,266 2,134,875 2,123,430 2,184,610 2,212,430
Total deposits 1,122,514 1,127,488 1,128,563 1,118,178 1,112,674 1,090,611 1,079,956 1,075,280
Long-term debt 249,221 251,772 259,825 253,678 251,055 258,717 270,198 273,999
Common shareholders’ equity 224,473 222,368 222,215 223,201 220,088 216,766 218,790 218,225
Total shareholders’ equity 243,448 238,034 235,797 236,553 233,415 230,392 235,063 236,995
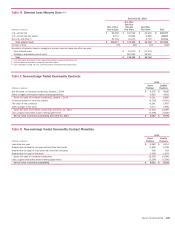
Asset quality (4)
Allowance for credit losses (5) $ 14,947 $ 15,635 $ 16,314 $ 17,127 $ 17,912 $ 19,912 $ 21,709 $ 22,927
Nonperforming loans, leases and foreclosed properties (6) 12,629 14,232 15,300 17,732 17,772 20,028 21,280 22,842
Allowance for loan and lease losses as a percentage of total loans
and leases outstanding (6) 1.65% 1.71% 1.75% 1.84% 1.90% 2.10% 2.33% 2.49%
Allowance for loan and lease losses as a percentage of total
nonperforming loans and leases (6) 121 112 108 97 102 100 103 102
Allowance for loan and lease losses as a percentage of total
nonperforming loans and leases, excluding the PCI loan portfolio (6) 107 100 95 85 87 84 84 82
Amounts included in allowance for loan and lease losses for loans and
leases that are excluded from nonperforming loans and leases (7) $ 5,944 $ 6,013 $ 6,488 $ 7,143 $ 7,680 $ 8,972 $ 9,919 $ 10,690
Allowance for loan and lease losses as a percentage of total
nonperforming loans and leases, excluding the allowance for loan
and lease losses for loans and leases that are excluded from
nonperforming loans and leases (6, 7) 71% 67% 64% 55% 57% 54% 55% 53%
Net charge-offs (8) $ 879 $ 1,043 $ 1,073 $ 1,388 $ 1,582 $ 1,687 $ 2,111 $ 2,517
Annualized net charge-offs as a percentage of average loans and
leases outstanding (6, 8) 0.40% 0.46% 0.48% 0.62% 0.68% 0.73% 0.94% 1.14%
Annualized net charge-offs as a percentage of average loans and
leases outstanding, excluding the PCI loan portfolio (6) 0.41 0.48 0.49 0.64 0.70 0.75 0.97 1.18
Annualized net charge-offs and PCI write-offs as a percentage of
average loans and leases outstanding (6) 0.40 0.57 0.55 0.79 1.00 0.92 1.07 1.52
Nonperforming loans and leases as a percentage of total loans and
leases outstanding (6) 1.37 1.53 1.63 1.89 1.87 2.10 2.26 2.44
Nonperforming loans, leases and foreclosed properties as a
percentage of total loans, leases and foreclosed properties (6) 1.45 1.61 1.70 1.96 1.93 2.17 2.33 2.53
Ratio of the allowance for loan and lease losses at period end to
annualized net charge-offs (8) 4.14 3.65 3.67 2.95 2.78 2.90 2.51 2.20
Ratio of the allowance for loan and lease losses at period end to
annualized net charge-offs, excluding the PCI loan portfolio 3.66 3.27 3.25 2.58 2.38 2.42 2.04 1.76
Ratio of the allowance for loan and lease losses at period end to
annualized net charge-offs and PCI write-offs 4.08 2.95 3.20 2.30 1.89 2.30 2.18 1.65
Capital ratios at period end (9)
Risk-based capital:
Common equity tier 1 capital 12.3% 12.0% 12.0% 11.8% n/a n/a n/a n/a
Tier 1 common capital n/a n/a n/a n/a 10.9% 10.8% 10.6% 10.3%
Tier 1 capital 13.4 12.8 12.5 11.9 12.2 12.1 11.9 12.0
Total capital 16.5 15.8 15.3 14.8 15.1 15.1 15.1 15.3
Tier 1 leverage 8.2 7.9 7.7 7.4 7.7 7.6 7.4 7.4
Tangible equity (3) 8.4 8.1 7.9 7.7 7.9 7.7 7.7 7.8
Tangible common equity (3) 7.5 7.2 7.1 7.0 7.2 7.1 7.0 6.9
For footnotes see page 126.