Bank of America 2014 Annual Report Download - page 112
Download and view the complete annual report
Please find page 112 of the 2014 Bank of America annual report below. You can navigate through the pages in the report by either clicking on the pages listed below, or by using the keyword search tool below to find specific information within the annual report.-
 1
1 -
2
-
3
-
4
-
5
-
6
-
7
-
8
-
9
-
10
-
11
-
12
-
13
-
14
-
15
-
16
-
17
-
18
-
19
-
20
-
21
-
22
-
23
-
24
-
25
-
26
-
27
-
28
-
29
-
30
-
31
-
32
-
33
-
34
-
35
-
36
-
37
-
38
-
39
-
40
-
41
-
42
-
43
-
44
-
45
-
46
-
47
-
48
-
49
-
50
-
51
-
52
-
53
-
54
-
55
-
56
-
57
-
58
-
59
-
60
-
61
-
62
-
63
-
64
-
65
-
66
-
67
-
68
-
69
-
70
-
71
-
72
-
73
-
74
-
75
-
76
-
77
-
78
-
79
-
80
-
81
-
82
-
83
-
84
-
85
-
86
-
87
-
88
-
89
-
90
-
91
-
92
-
93
-
94
-
95
-
96
-
97
-
98
-
99
-
100
-
101
-
 102
102 -
 103
103 -
 104
104 -
 105
105 -
 106
106 -
 107
107 -
 108
108 -
 109
109 -
 110
110 -
 111
111 -
 112
112 -
 113
113 -
 114
114 -
 115
115 -
 116
116 -
 117
117 -
 118
118 -
 119
119 -
 120
120 -
 121
121 -
 122
122 -
123
-
124
-
125
-
126
-
127
-
128
-
129
-
130
-
131
-
132
-
133
-
134
-
135
-
136
-
137
-
138
-
139
-
140
-
141
-
142
-
143
-
144
-
145
-
146
-
147
-
148
-
149
-
150
-
151
-
152
-
153
-
154
-
155
-
156
-
157
-
158
-
159
-
160
-
161
-
162
-
163
-
164
-
165
-
166
-
167
-
168
-
169
-
170
-
171
-
172
-
173
-
174
-
175
-
176
-
177
-
178
-
179
-
180
-
181
-
182
-
183
-
184
-
185
-
186
-
187
-
188
-
189
-
190
-
191
-
192
-
193
-
194
-
195
-
196
-
197
-
198
-
199
-
200
-
201
-
202
-
203
-
204
-
205
-
206
-
207
-
208
-
209
-
210
-
211
-
212
-
213
-
214
-
215
-
216
-
217
-
218
-
219
-
220
-
221
-
222
-
223
-
224
-
225
-
226
-
227
-
228
-
229
-
230
-
231
-
232
-
233
-
234
-
235
-
236
-
237
-
238
-
239
-
240
-
241
-
242
-
243
-
244
-
245
-
246
-
247
-
248
-
249
-
250
-
251
-
252
-
253
-
254
-
255
-
256
-
257
-
258
-
259
-
260
-
261
-
262
-
263
-
264
-
265
-
266
-
267
-
268
-
269
-
270
-
271
-
272
 |
 |
110 Bank of America 2014
Estimating the fair value of reporting units is a subjective
process that involves the use of estimates and judgments,
particularly related to cash flows, the appropriate discount rates
and an applicable control premium. We determined the fair values
of the reporting units using a combination of valuation techniques
consistent with the market approach and the income approach
and also utilized independent valuation specialists.
The market approach we used estimates the fair value of the
individual reporting units by incorporating any combination of the
tangible capital, book capital and earnings multiples from
comparable publicly-traded companies in industries similar to that
of the reporting unit. The relative weight assigned to these
multiples varies among the reporting units based on qualitative
and quantitative characteristics, primarily the size and relative
profitability of the reporting unit as compared to the comparable
publicly-traded companies. Since the fair values determined under
the market approach are representative of a noncontrolling
interest, we added a control premium to arrive at the reporting
units’ estimated fair values on a controlling basis.
For purposes of the income approach, we calculated
discounted cash flows by taking the net present value of estimated
future cash flows and an appropriate terminal value. Our
discounted cash flow analysis employs a capital asset pricing
model in estimating the discount rate (i.e., cost of equity financing)
for each reporting unit. The inputs to this model include the risk-
free rate of return, beta, which is a measure of the level of non-
diversifiable risk associated with comparable companies for each
specific reporting unit, size premium to reflect the historical
incremental return on stocks, market equity risk premium and in
certain cases an unsystematic (company-specific) risk factor. The
unsystematic risk factor is the input that specifically addresses
uncertainty related to our projections of earnings and growth,
including the uncertainty related to loss expectations. We utilized
discount rates that we believe adequately reflect the risk and
uncertainty in the financial markets generally and specifically in
our internally developed forecasts. We estimated expected rates
of equity returns based on historical market returns and risk/return
rates for similar industries of each reporting unit. We use our
internal forecasts to estimate future cash flows and actual results
may differ from forecasted results.
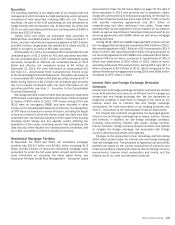
2014 Annual Impairment Test
During the three months ended September 30, 2014, we
completed our annual goodwill impairment test as of June 30,
2014 for all of our reporting units that had goodwill. In performing
the first step of the annual goodwill impairment analysis, we
compared the fair value of each reporting unit to its estimated
carrying value as measured by allocated equity, which includes
goodwill. During our 2014 annual goodwill impairment test, we
also evaluated the U.K. Card business within All Other, as the U.K.
Card business comprises the majority of the goodwill included in
All Other. To determine fair value, we utilized a combination of the
market approach and the income approach. Under the market
approach, we compared earnings and equity multiples of the
individual reporting units to multiples of public companies
comparable to the individual reporting units. The control premium
used in the June 30, 2014 annual goodwill impairment test was
30 percent for all reporting units. Under the income approach, we
updated our assumptions to reflect the current market
environment. The discount rates used in the June 30, 2014 annual
goodwill impairment test ranged from 10.5 percent to 13 percent
depending on the relative risk of a reporting unit. Growth rates
developed by management for individual revenue and expense
items in each reporting unit ranged from (2.9) percent to 8.5
percent.
Based on the results of step one of the annual goodwill
impairment test, we determined that step two was not required
for any of the reporting units as their fair value exceeded their
carrying value indicating there was no impairment.
The fair value for Card Services as of June 30, 2014 no longer
considers the negative impact of a July 31, 2013 court ruling
regarding the Federal Reserve’s rules on debit card interchange
fees, which would have required the Federal Reserve to reconsider
the cap on debit card interchange fees. The fair value as of June
30, 2013 considered that potential negative impact contributing
to an estimated fair value as a percent of allocated carrying value
of 120.3 percent. The U.S. Supreme Court indicated in January
2015 that it would not hear the challenge to the Federal Reserve’s
debit card interchange fee rules.
2013 Annual Impairment Tests
During the three months ended September 30, 2013, we
completed our annual goodwill impairment test as of June 30,
2013 for all of our reporting units which had goodwill. Additionally,
we also evaluated the U.K. Card business within All Other as the
U.K. Card business comprises the majority of the goodwill included
in All Other.
Based on the results of step one of the annual goodwill
impairment test, we determined that step two was not required
for any of the reporting units as their respective fair values
exceeded their carrying values indicating there was no impairment.
Representations and Warranties Liability
The methodology used to estimate the liability for obligations under
representations and warranties related to transfers of residential
mortgage loans is a function of the representations and warranties
given and considers a variety of factors. Depending upon the
counterparty, these factors include actual defaults, estimated
future defaults, historical loss experience, estimated home prices,
other economic conditions, estimated probability that we will
receive a repurchase request, number of payments made by the
borrower prior to default and estimated probability that we will be
required to repurchase a loan. It also considers other relevant
facts and circumstances, such as bulk settlements and identity
of the counterparty or type of counterparty, as appropriate. The
estimate of the liability for obligations under representations and
warranties is based upon currently available information,
significant judgment, and a number of factors, including those set
forth above, that are subject to change. Changes to any one of
these factors could significantly impact the estimate of our liability.
The representations and warranties provision may vary
significantly each period as the methodology used to estimate the
expense continues to be refined based on the level and type of
repurchase requests presented, defects identified, the latest
experience gained on repurchase requests and other relevant facts
and circumstances. The estimate of the liability for representations
and warranties is sensitive to future defaults, loss severity and
the net repurchase rate. An assumed simultaneous increase or
decrease of 10 percent in estimated future defaults, loss severity
and the net repurchase rate would result in an increase or decrease
of approximately $400 million in the representations and
warranties liability as of December 31, 2014. These sensitivities
are hypothetical and are intended to provide an indication of the